Phasor Model for RC Filter Electronic Circuit


Requires a Wolfram Notebook System
Interact on desktop, mobile and cloud with the free Wolfram Player or other Wolfram Language products.
This Demonstration shows the phasor model for the steady-state behavior of a series RC circuit with a sinusoidal input. It lets you change the values of the resistance  and capacitance
  in the circuit and the angular frequency
  of the input to examine the amplitude and phase relationships for the system. It also shows how this behavior can be exploited as either a high-pass or low-pass filter.
Contributed by: Michael R. Braunstein (Central Washington University) (March 2011)
Open content licensed under CC BY-NC-SA
Snapshots


Details
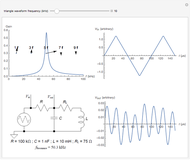
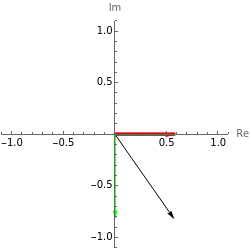
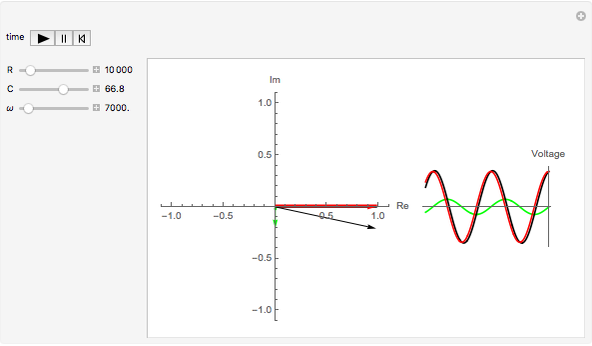
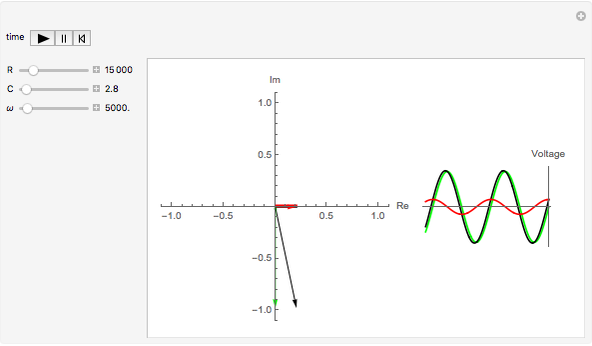
The phasor model is shown in the left-hand plot in the animation window. In the animation, the black phasor corresponds to the input voltage (with arbitrary amplitude 1), the red phasor corresponds to the voltage across the resistor, and the green phasor corresponds to the voltage across the capacitor. The angular frequency of the input is in units of radians/second, the resistor value is in units of ohms, and the capacitor value is in nanofarads. By varying , , and in the animation you can investigate how they affect the relative phases and amplitudes of the different voltages across components in the circuit.
You can also investigate the animation using just the initial values for R and C and varying only : the behavior of the phasors under these conditions gives a wonderful illustration of how taking the output voltage across the capacitor (resistor) can be exploited as a low-pass (high-pass) filter. Remember that the voltage measured by an instrument is just the projection of the phasor on the real axis and so, when measured, each of these voltages will be sinusoidal with angular frequency and with an amplitude determined by the amplitude (length) of the phasor, as shown by the colored bars on the horizontal axis.
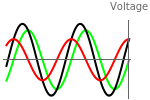
The right-hand plot in the animation window shows the time evolution of the voltages for different values of the parameters, again showing the phase and amplitude relationship. Its leading edge, the right edge of the plot at the vertical voltage axis, shows the value of the voltages corresponding to the phasors at any given instant.
Permanent Citation
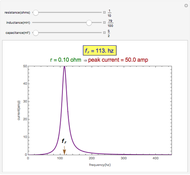 Frequency Response of an LCR Circuit
Contributed by: Kallol Das (St. Aloysius College, Jabalpur, India)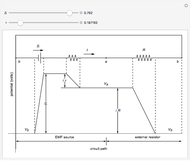 Potential Differences in a Circuit with an EMF Source
Enrique Zeleny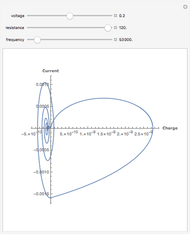 Chaotic Oscillation Circuit
Michael Schreiber Magnetic Circuits
Stephen Wilkerson (United States Military Academy West Point)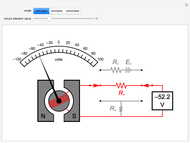 Galvanometer as a DC Multimeter
S. M. Blinder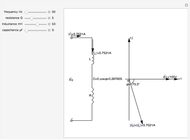 Improving Power Factors in an AC Circuit
Anping Zeng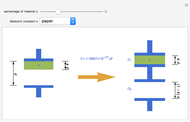 Partially Filled Capacitor
Enrique Zeleny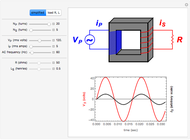 AC Transformers
S. M. Blinder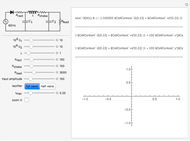 Pi Filter
Selwyn Hollis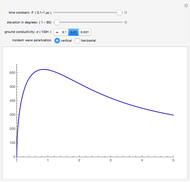 Open Circuit Voltage Coupled into a Semi-Infinite Transmission Line by an Exponential, Plane Waveform
Michael J. Walker