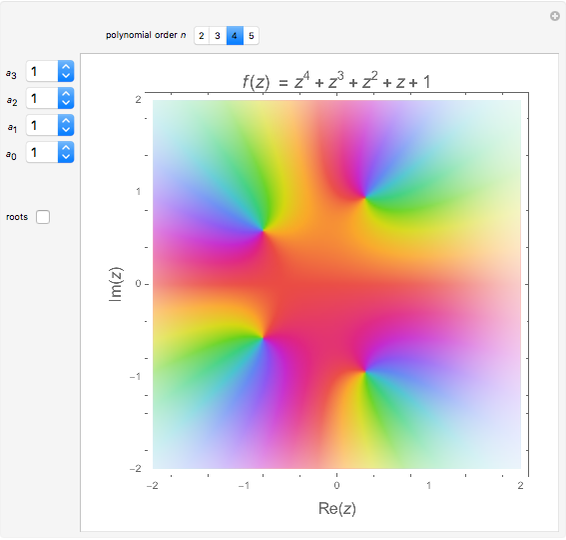
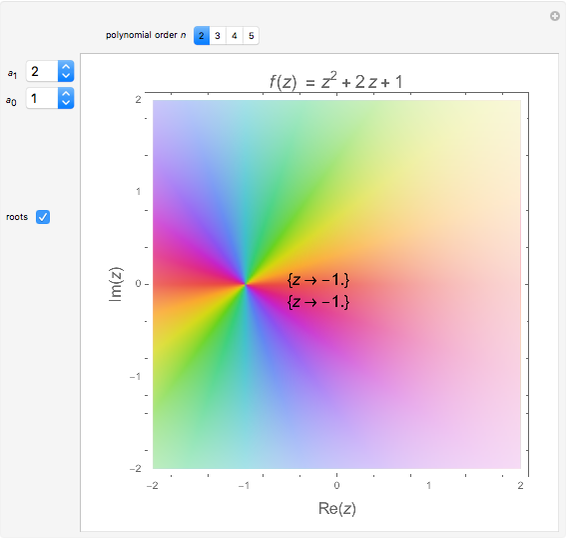
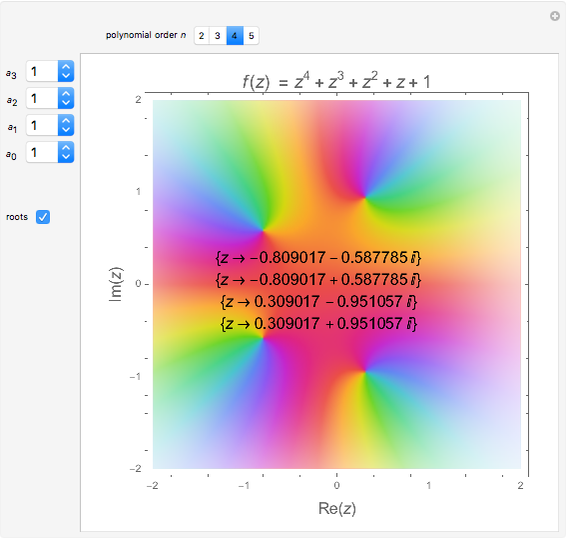
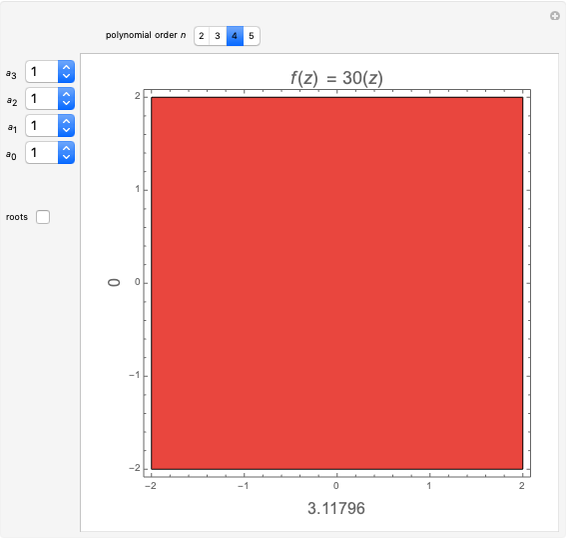
Polynomials in the Complex Plane
Initializing live version

Requires a Wolfram Notebook System
Interact on desktop, mobile and cloud with the free Wolfram Player or other Wolfram Language products.
When you plot a polynomial
[more]


Contributed by: S. M. Blinder (January 2020)
Open content licensed under CC BY-NC-SA
Details
References
[1] D. J. Velleman, "The Fundamental Theorem of Algebra: A Visual Approach," The Mathematical Intelligencer, 37(4), 2015 pp. 12–21. doi:10.1007/s00283-015-9572-7.
[2] S. Wolfram. "Phase of a Complex Polynomial" from the Wolfram Demonstrations Project—A Wolfram Web Resource. demonstrations.wolfram.com/PhaseOfAComplexPolynomial.
Snapshots


Permanent Citation
Related Demonstrations
More by Author
 Polynomial Roots in the Complex Plane
Faisal Mohamed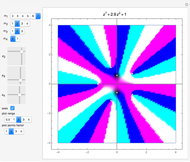 Roots of a Polynomial with Complex Coefficients
Izidor Hafner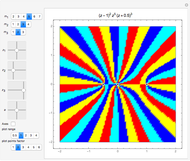 Perturbing the Constant Coefficient of a Complex Polynomial
Izidor Hafner Pisot, Salem and Cyclotomic Polynomials
Ed Pegg Jr Ruffini-Horner Algorithm for Complex Arguments
Izidor Hafner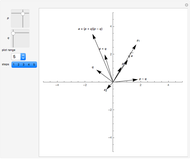 Graphical Solution of a Quadratic Equation with Complex Coefficients
Izidor Hafner and Marko Razpet Locating the Complex Roots of a Quadratic Equation
Jaime Rangel-Mondragon Location of Complex Roots of a Real Quadratic
Dominic Milioto Location of the Zeros of a Polynomial with Positive Ordered Coefficients
Vanessa Botta and Evanize Rodrigues Castro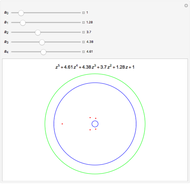 The Eneström-Kakeya Bounds for Roots of a Polynomial with Positive Coefficients
Andrzej Kozlowski
-
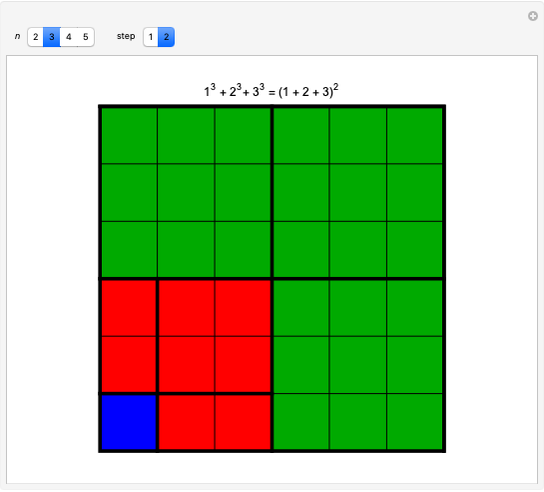 Fry's Geometric Demonstration of the Sum of Cubes
S. M. Blinder -
 Polynomials in the Complex Plane
S. M. Blinder -
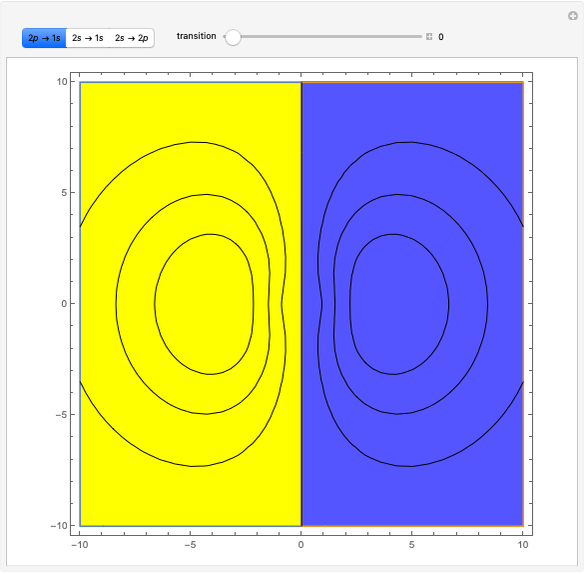 Anatomy of a Quantum Jump
S. M. Blinder -
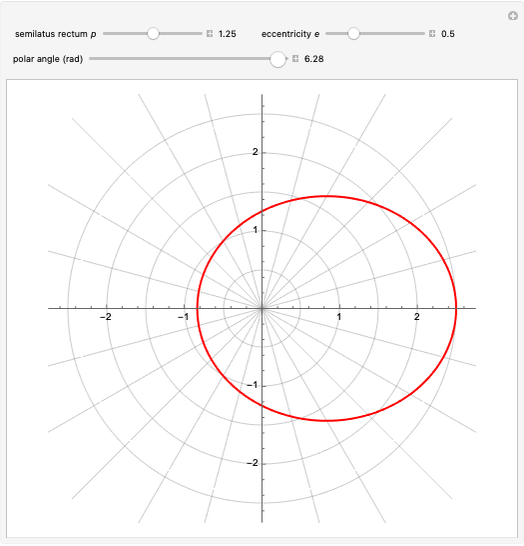 Polar Plots of Conic Sections
S. M. Blinder -
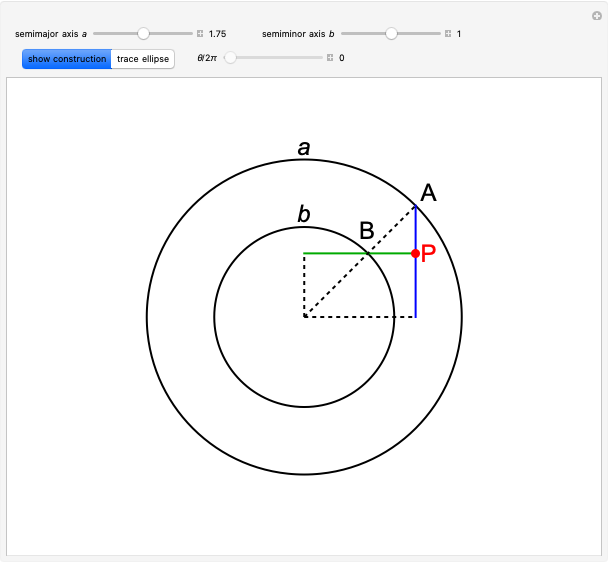 De La Hire's Construction of an Ellipse
S. M. Blinder -
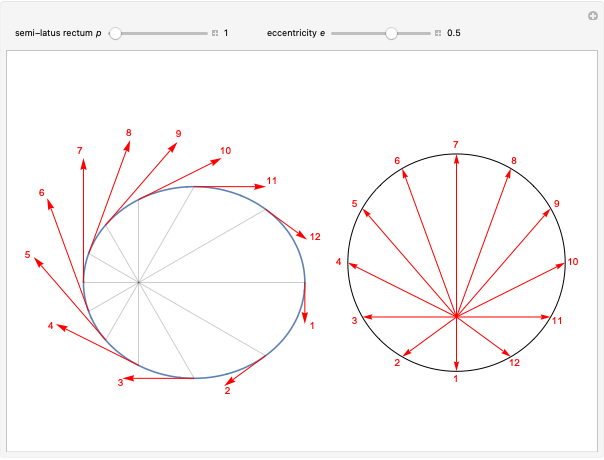 Hodographs for Kepler Orbits
S. M. Blinder -
 Polarizability of Hydrogen Atoms
S. M. Blinder -
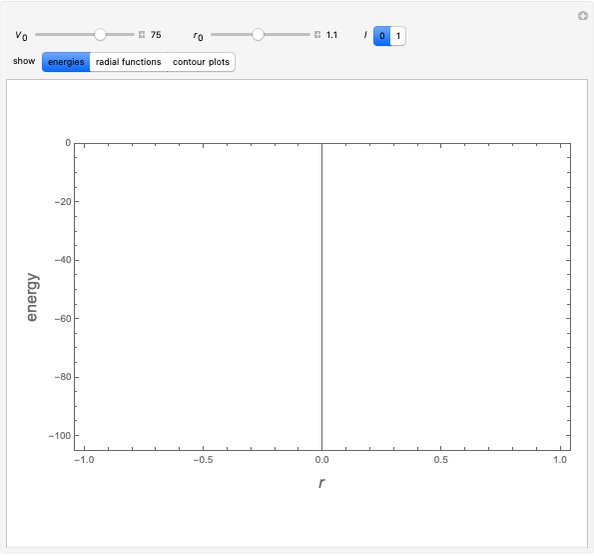 Solutions of Schrödinger Equation for a Particle in a Finite Spherical Well
S. M. Blinder -
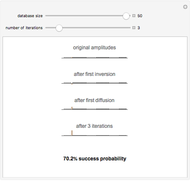 Simulated Quantum Computer Algorithm for Database Searching
S. M. Blinder -
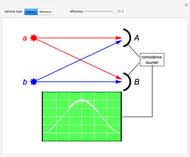 Hanbury Brown and Twiss Interference for Bosons and Fermions
S. M. Blinder -
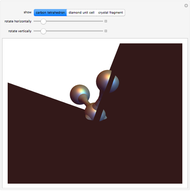 The Structure of Diamond
S. M. Blinder -
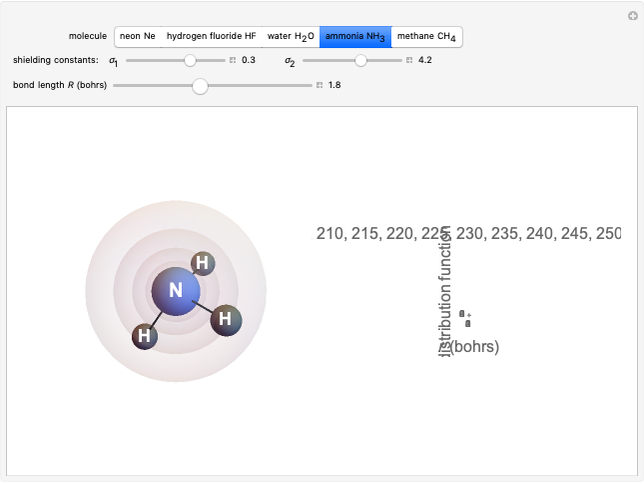 Hydrides as Isoelectronic Perturbations of the Neon Atom
S. M. Blinder -
 Zero-Energy Limit of Coulomb Wavefunctions
S. M. Blinder -
 Density Functional Computations on Noble Gas Atoms
S. M. Blinder -
 Exact Solutions of the Schrödinger Equation for the Kratzer Potential
S. M. Blinder -
 Exact Solutions of the Schrödinger Equation for Pseudoharmonic Potential
S. M. Blinder -
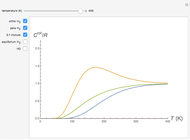 Low-Temperature Heat Capacity of Hydrogen Molecules
S. M. Blinder -
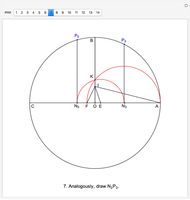 Constructing a Regular Heptadecagon (17-gon) with Ruler and Compass
S. M. Blinder -
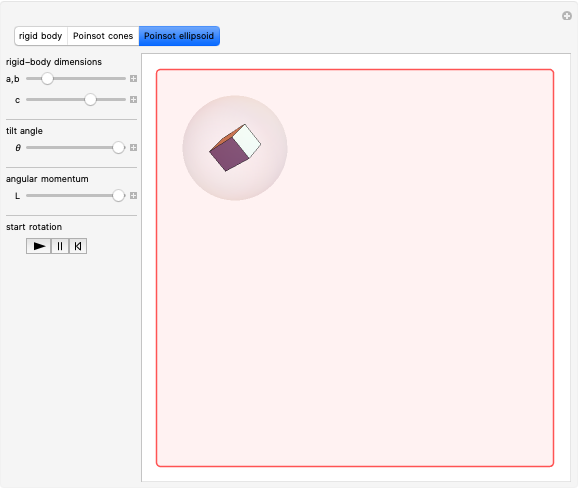 Free Rotation of a Rigid Body: Poinsot Constructions
S. M. Blinder -
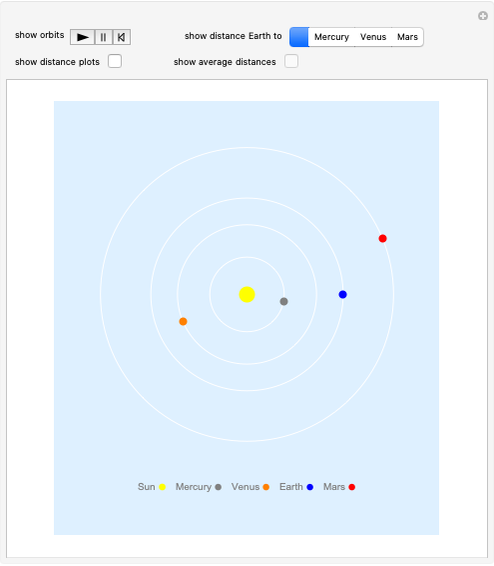 Venus Is Not the Earth's Closest Planetary Neighbor
S. M. Blinder