Probability Distribution for the kth Greatest of a Sequence of n Random Numbers

Requires a Wolfram Notebook System
Interact on desktop, mobile and cloud with the free Wolfram Player or other Wolfram Language products.
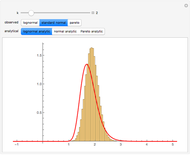
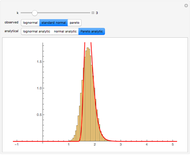
This Demonstration shows a simple example of using extreme value theory to calculate the probability density function for the  greatest number in a series of
  random numbers drawn from three distributions of some importance in financial calculations. Many observations of the
  greatest number in a sample of size
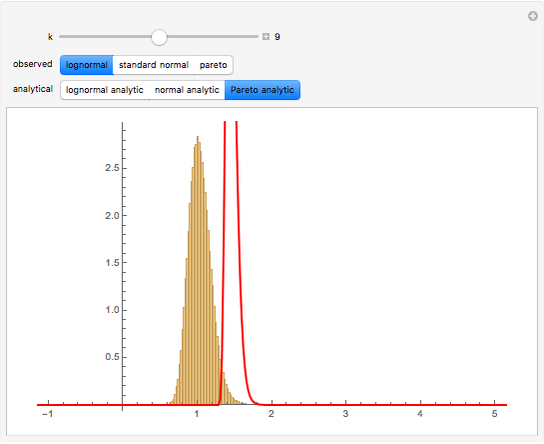
  drawn randomly from the specified distribution are taken and displayed via a histogram. The red curve is the graph of the analytical expression for the smallest number, derived by considering the probability that, in a sequence of random numbers,
  numbers are greater than
  and
and  numbers are smaller, all this weighted by the binomial distribution (see Details).
Contributed by: Felipe Dimer de Oliveira (March 2011)
Open content licensed under CC BY-NC-SA
Snapshots


Details
The probability that random numbers are smaller than is given by the joint probability that each one of the random numbers is smaller than . If the observations in the sample are independent of each other we then have
 ,
,
where  is the cumulative distribution function (CDF). The probability density function of the maximum of the observations is the derivative of
  . The generalization for the greatest number in a sequence is then given by the probability of obtaining
  in observations while obtaining observations which are greater than . To account for all possible permutations with which
  can be less than the probability must be weighted by a binomial factor,
 .
.
Permanent Citation
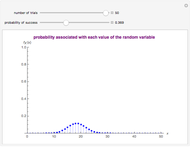 Binomial Probability Distribution
Paul Savory (University of Nebraska ? Lincoln)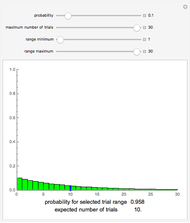 Probability in a Geometric Distribution
Daniel Tokarz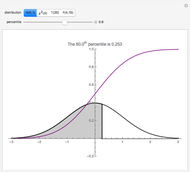 Percentiles of Certain Probability Distributions
Chris Boucher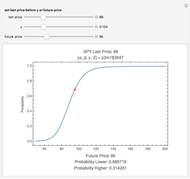 Stock Price Probability with Stable Distributions
Bob Rimmer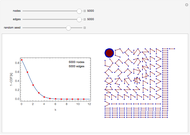 Degree Distribution on a Random Network
Jorge Villalobos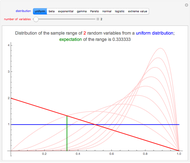 Distribution of the Sample Range of Continuous Random Variables
Heikki Ruskeepää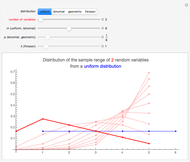 Distribution of the Sample Range of Discrete Random Variables
Heikki Ruskeepää Distribution of the Means of Samples Having Random Sizes
Mark D. Normand, Joseph Horowitz, and Micha Peleg Central Limit Theorem Illustrated with Four Probability Distributions
D. Meliga and S. Z. Lavagnino Random Values from Distributions
Chris Boucher