Radioactive Decay or Drug Degradation


Requires a Wolfram Notebook System
Interact on desktop, mobile and cloud with the free Wolfram Player or other Wolfram Language products.
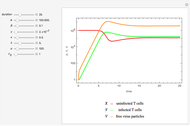
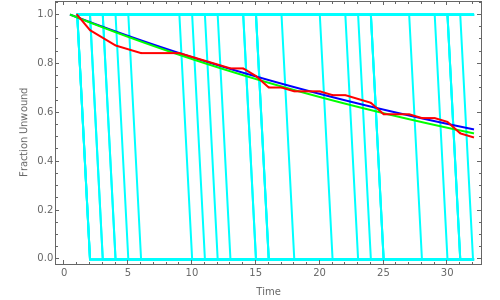
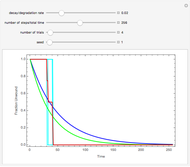
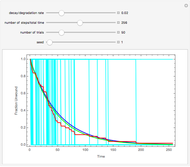
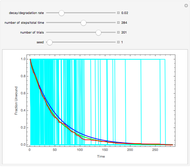
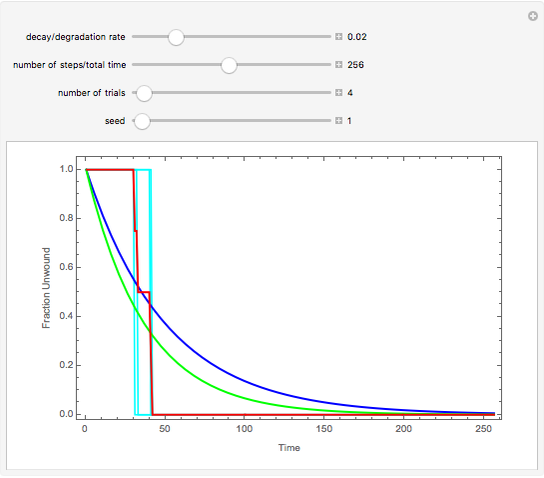
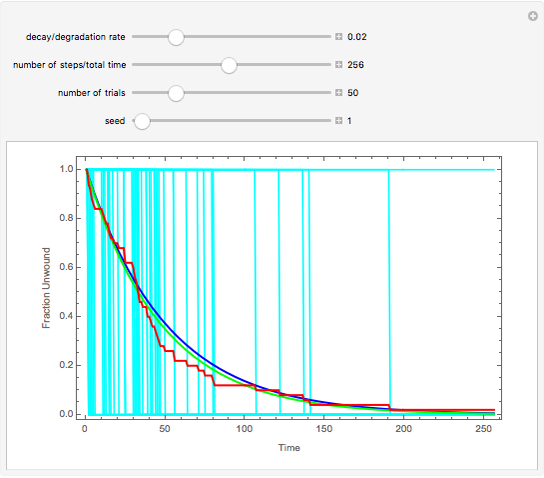
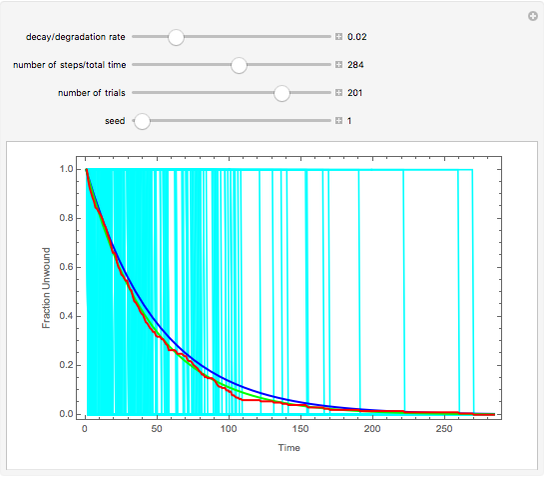
This Demonstration simulates a random decay/degradation process. It could represent the decay of radioactive nuclei or the degradation of a therapeutic drug in the human body. Individual decays or degradation events are visualized via the thin cyan lines. The red line is the mean of all the events. The blue line is a simple exponential function, characterized by the input decay/degradation rate. The green line is an exponential function, characterized by a maximum-likelihood estimate of the decay/degradation rate, calculated using the measured decay/degradation times. For a large number of events, the red, green, and blue curves coincide.
Contributed by: Simon Mochrie (July 2011)
Open content licensed under CC BY-NC-SA
Snapshots
Details
detailSectionParagraphPermanent Citation
"Radioactive Decay or Drug Degradation"
http://demonstrations.wolfram.com/RadioactiveDecayOrDrugDegradation/
Wolfram Demonstrations Project
Published: July 15 2011
 Radioactive Decay as a Probability Distribution
Olexandr Eugene Prokopchenko Radioactive Decay of Five Elements: Time Dependence of Remaining Mass
Daniel Relix and Mito Are (Collin College)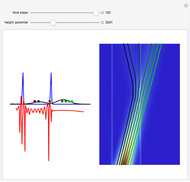 Radioactive Decay in the Causal Interpretation of Quantum Theory
Klaus von Bloh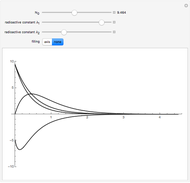 A Model for Successive Radioactive Decays
Olexandr Eugene Prokopchenko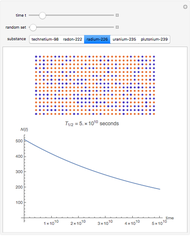 Half-Life of a Radioactive Element
Enrique Zeleny The OZI Rule in Meson Decay
Michal Petran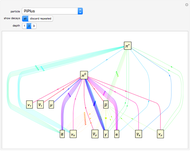 Hadron Decays
Enrique Zeleny Nuclear Meltdown on Mars
Jonathan Lo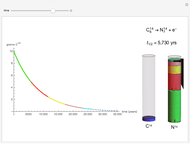 Half-Life of a Radioactive Decay
Kyle Tomczak, John Ziebec, Stephen Koveck, Hiral Bharatia, and Chris Sicinski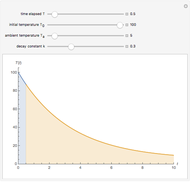 Newton's Law of Cooling
Jeff Bryant