Residue Curve Map for a Non-Ideal Ternary Mixture with a Distillation Boundary


Requires a Wolfram Notebook System
Interact on desktop, mobile and cloud with the free Wolfram Player or other Wolfram Language products.
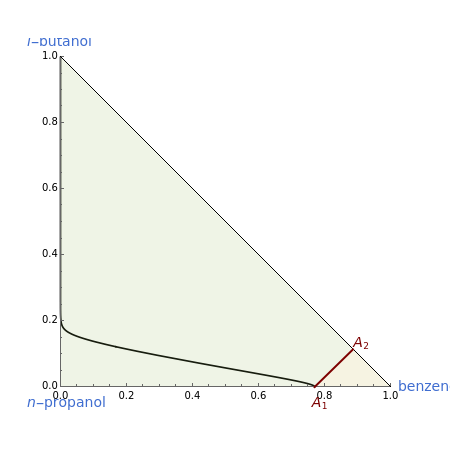
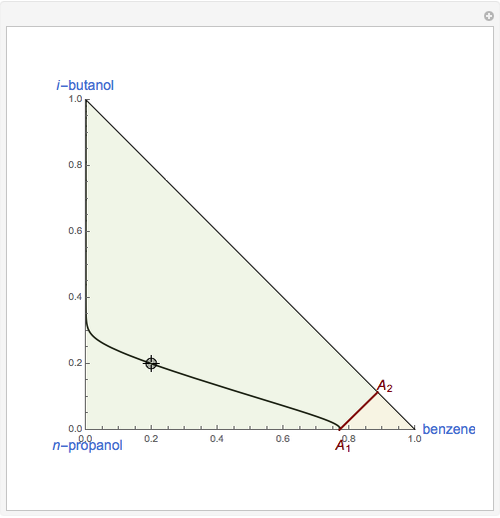
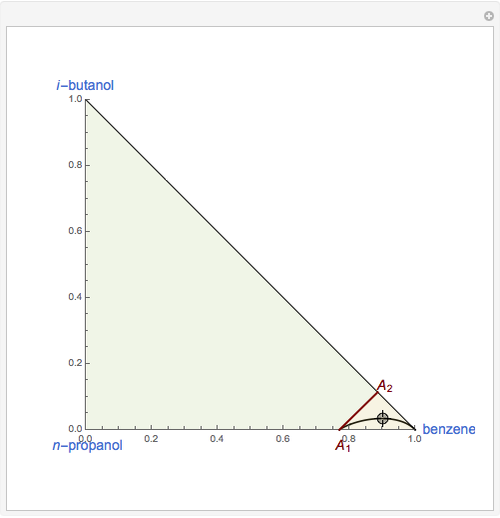
This Demonstration plots the residue curve of a non-ideal ternary mixture composed of benzene,  -butanol and
  -propanol. Deviation from ideal behavior in the liquid phase is taken into account using the Wilson model in order to compute the activity coefficients. The total pressure is 101.325 kPa. This mixture presents two azeotropes: (1) between benzene and
  -propanol, marked in the ternary diagram by
  (77% mole fraction of benzene); (2) between benzene and
  -butanol, marked in the ternary diagram by
  (88.62% mole fraction of benzene). This ternary mixture has two distillation regions (the yellow and green shaded areas) with a distillation boundary connecting the two binary azeotropes (the straight red segment in the diagram). Benzene and
  -butanol are stable nodes;
  -propanol and
  are two saddle points, and finally
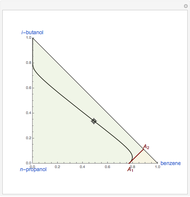
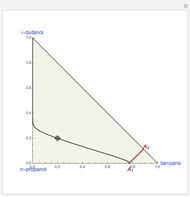
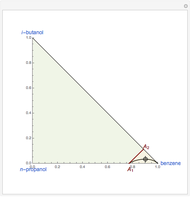
  is an unstable node. You can change the position of the locator to plot the residue curve passing at the locator position.
Contributed by: Housam Binous (March 2011)
Open content licensed under CC BY-NC-SA
Snapshots

Details
For more information, see
M. F. Doherty and M. F. Malone, Conceptual Design of Distillation Systems, New York: McGraw-Hill, 2001.
 The Residue Curve Map (RCM) of a Ternary Mixture at Various Pressures
Housam Binous Distillation of a Ternary Ideal Mixture
Housam Binous, Naim Faqir, and Abdallah Al-Shammari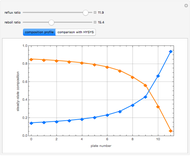 Rigorous Simulation for Distillation of Non-Ideal Binary Mixture
Housam Binous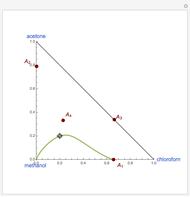 Residue Curve Map Presenting Four Distillation Regions
Housam Binous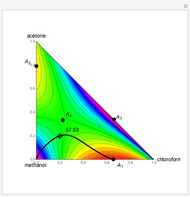 Residue Curve and Bubble Temperature Distribution for a Ternary Mixture
Housam Binous, Ikbel El Glaoui, and Ahmed Bellagi Binary Distillation of Non-Ideal Mixtures Using Driving-Force Diagrams
Housam Binous Residue Curve Map for a Benzene-Toluene-p-Xylene Mixture
Housam Binous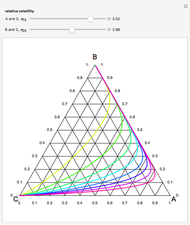 Residue Curve Maps in a Triangular Ternary Diagram
Housam Binous, Brian G. Higgins, and Ahmed Bellagi Residue Curve Map for a Mixture of Three Alcohols; Nature of the Singular Points
Housam Binous Residue Curve Map for a Mixture of Water, Ethanol, and Ethylene Glycol
Housam Binous
-
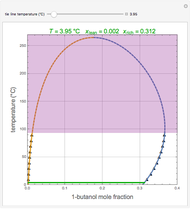 Liquid-Liquid Equilibrium for the 1-Butanol-Water System
Housam Binous -
 Temperature Dependence of Dehydrogenation of Ethyl Benzene to Styrene
Housam Binous -
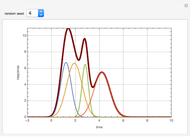 Deconvolution of a Chromatogram
Housam Binous -
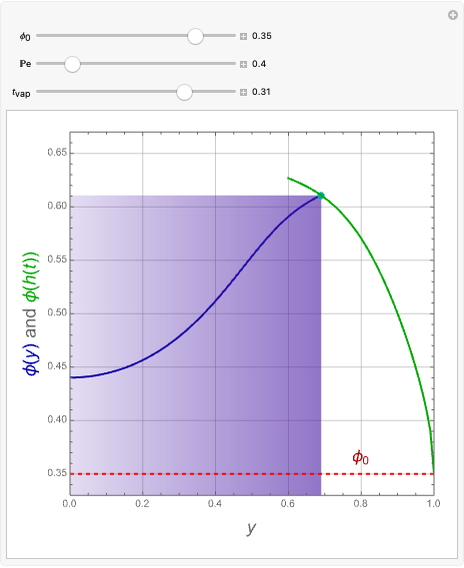 Distribution of Colloidal Particles during Solvent Evaporation
Housam Binous -
 Heat Conduction in a Rod
Housam Binous -
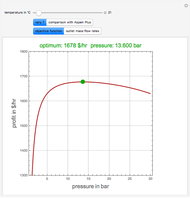
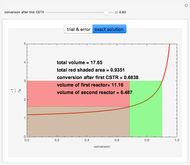 Optimal Setup of Two Continuous Stirred-Tank Reactors (CSTRs) in Series
Housam Binous -
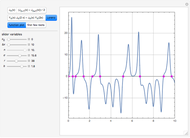
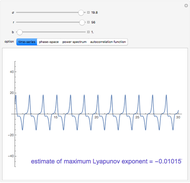 Study of the Dynamic Behavior of the Lorenz System
Housam Binous -
 A Graphically Enhanced Method for Computing Real Roots of Nonlinear Functions
Housam Binous -
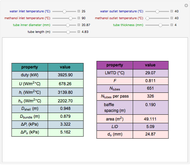 Design of a Shell and Tube Heat Exchanger
Housam Binous -
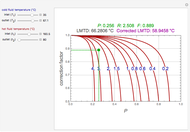 Correction Factor for Shell and Tube Heat Exchanger
Housam Binous -
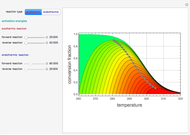 Contour Plots for Reaction Rates
Housam Binous -
 Optimal Conditions for CO2/n-Hexane Flash Separation
Housam Binous -
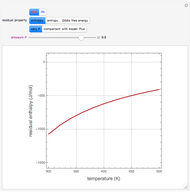 Residual Functions for the SRK and PR Equations of State
Housam Binous -
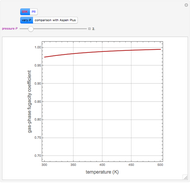 Gas-Phase Fugacity Coefficients for Propylene
Housam Binous -
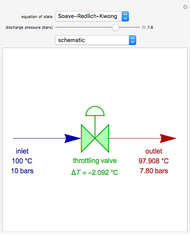 Operation of a Throttling Valve
Housam Binous -
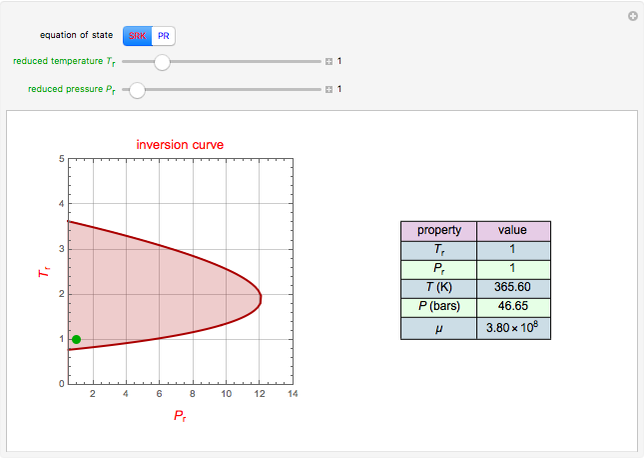 Joule-Thomson Inversion Curves for Soave-Redlich-Kwong (SRK) and Peng-Robinson (PR) Equations of State
Housam Binous -
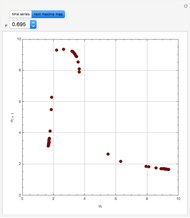
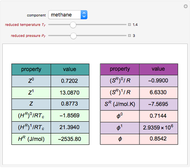 Lee-Kesler Generalized Correlations for Gases
Housam Binous -
 Mapping the Maxima for a Nonisothermal Chemical System
Housam Binous -
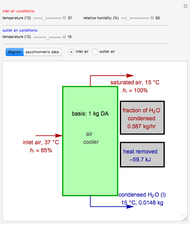 Operation of an Air Conditioner
Housam Binous -
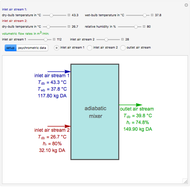 Adiabatic Mixing of Two Moist Air Streams
Housam Binous