Rotation-Vibration Energy Level Transitions of a Diatomic Rotor


Requires a Wolfram Notebook System
Interact on desktop, mobile and cloud with the free Wolfram Player or other Wolfram Language products.
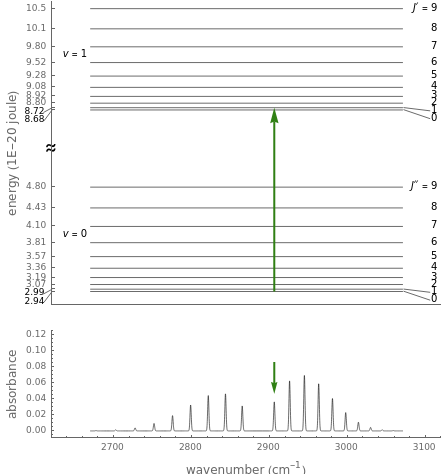
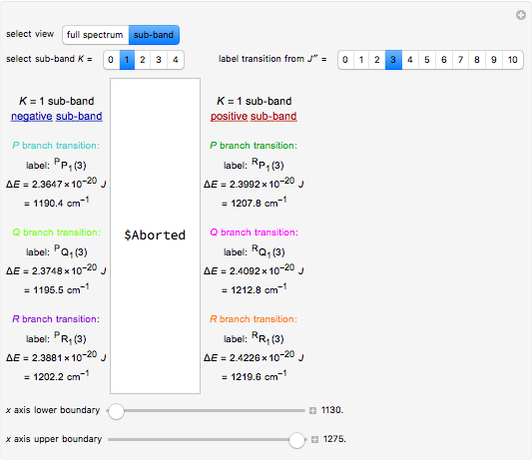
This Demonstration shows the energy level transitions associated with each line observed in a rotationally resolved infrared band spectrum, in which the  vibrational transition is coupled with
  rotational transitions. For a diatomic molecule the vibrational and rotational energy levels are quantized and the selection rules are
  (vibration) and
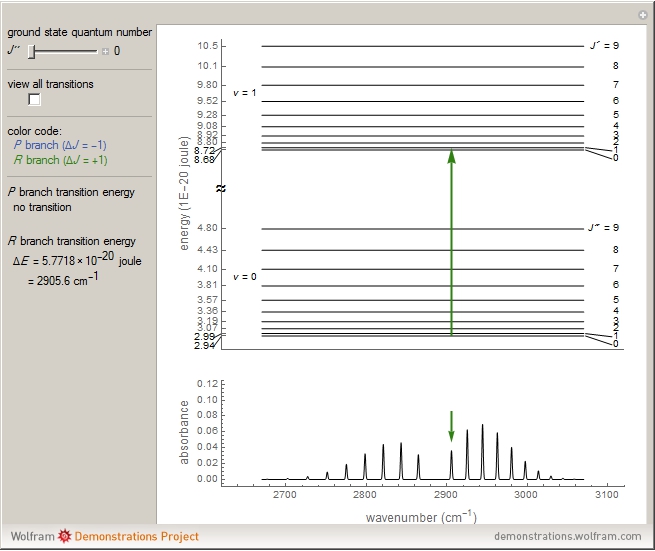
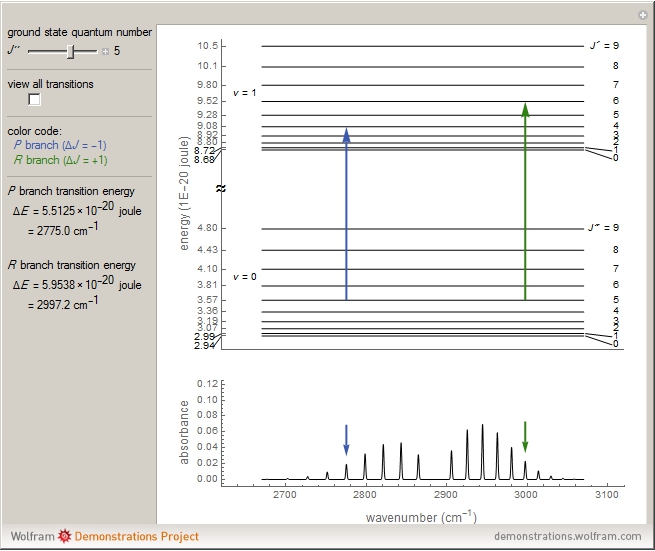
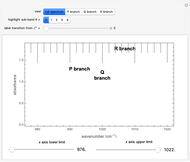
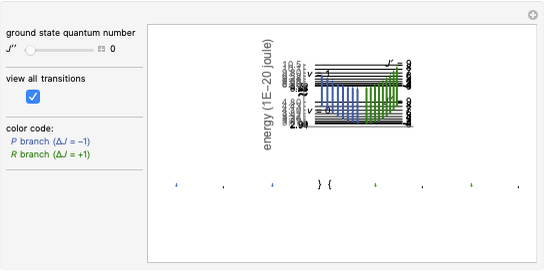
  (rotation). Only transitions that meet the selection rule requirements are allowed, and as a result discrete spectral lines are observed, as shown in the bottom graphic. The position of a spectral line corresponds to the energy difference between the initial and final states of the transition. These energy level transitions from the ground to excited rotation-vibration states are shown in the top graphic. The spectrum consists of a
  branch (
 ,
,  , smaller wavenumbers, lower energy transitions) and an
  branch (,
  , larger wavenumbers, higher energy transitions). The central gap between the and branches represents the forbidden
  branch since the
  selection rule makes the
  transitions forbidden. A branch can appear, however, if the molecule has electronic angular momentum, a well-known case being the NO molecule.
Contributed by: Whitney R. Hess and Lisa M. Goss (Idaho State University) (March 2011)
Open content licensed under CC BY-NC-SA
Snapshots
Details
This Demonstration utilizes molecular constants of the molecule  and the infrared spectrum is simulated at a temperature of 200 Kelvin.
molecular constants:
 = 2990.946
 = 52.8186
 = 10.59341
 = 0.30718
 = 5.3194E-04
The intensity of the observed spectral lines reflects the dependence on the thermal population of the initial rotational energy levels and the dependence on the quantum number  , not on the magnitude of the corresponding transition energy.
Note: the  axis on the energy level diagram (top graphic) is arbitrary. The arrows indicating transitions in the top graphic are spread out for clarity and so that their positioning lies directly above the corresponding transition wavenumber in the spectrum below (bottom graphic).
References:
[1] P. Atkins and J. de Paula, Physical Chemistry, New York: Oxford University Press, 2006.
[2] G. Herzberg, Molecular Spectra and Molecular Structure I. Spectra of Diatomic Molecules, Princeton, New Jersey: D. Van Nostrand Company, Inc., 1950.
[3] K. P. Huber and G. Herzberg, Molecular Spectra and Molecular Structure IV. Constants of Diatomic Molecules, New York: Van Nostrand Reinhold Company, 1979.
[4] Diatomic Constants for HCl. webbook.nist.gov/cgi/cbook.cgi?ID=C7647010&Units=SI&Mask=1000# Diatomic (NIST Chemistry WebBook. webbook.nist.gov/chemistry).
Permanent Citation
 Rotation-Vibration Transitions of a Parallel Band of a Symmetric Rotor
Whitney R. Hess and Lisa M. Goss Energy Levels of a Morse Oscillator
S. M. Blinder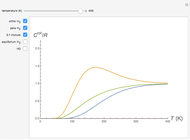 Low-Temperature Heat Capacity of Hydrogen Molecules
S. M. Blinder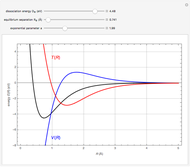 Virial Theorem for Diatomic Molecules
S. M. Blinder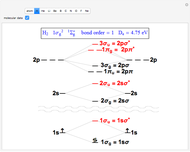 Molecular Orbitals for First- and Second-Row Diatomic Molecules
S. M. Blinder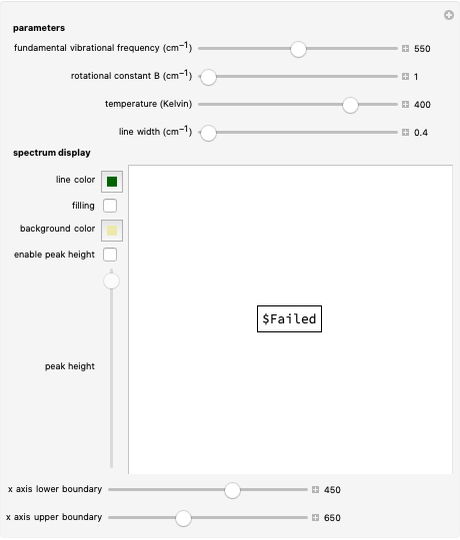 Rovibronic Infrared Spectrum of a Rigid Diatomic Rotor
Whitney R. Hess and Lisa M. Goss (Idaho State University) Rovibronic Spectrum of a Perpendicular Band of a Symmetric Rotor
Whitney R. Hess and Lisa M. Goss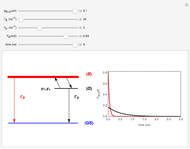 Rate Equations for a Three-Level Model in Low-Dimensional Exciton Systems
Jessica Alfonsi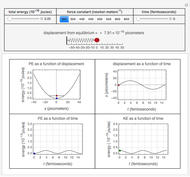 Energy and Position Relationships in Simple Harmonic Motion
Whitney R. Hess and Lisa M. Goss (Idaho State University)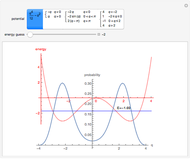 Quantum Well Explorer
Richard Gass
-
 Rotation-Vibration Transitions for a Perpendicular Band of a Symmetric Rotor
Lisa M. Goss -
Rovibronic Spectrum of a Perpendicular Band of a Symmetric Rotor
Lisa M. Goss -
Rotation-Vibration Transitions of a Parallel Band of a Symmetric Rotor
Lisa M. Goss -
 Rovibronic Spectrum of a Parallel Band of a Symmetric Rotor
Lisa M. Goss -
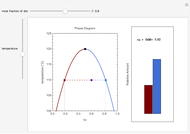
 Lever Rule for the Uranium-Titanium Solid-Liquid Phase Diagram
Lisa M. Goss -
 Rotation-Vibration Energy Level Transitions of a Diatomic Rotor
Lisa M. Goss -
 Lever Rule Applied to Phase Diagram for Partially Miscible Liquids
Lisa M. Goss -
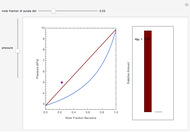 Lever Rule Applied to the Benzene-Toluene Vapor Pressure Diagram
Lisa M. Goss -
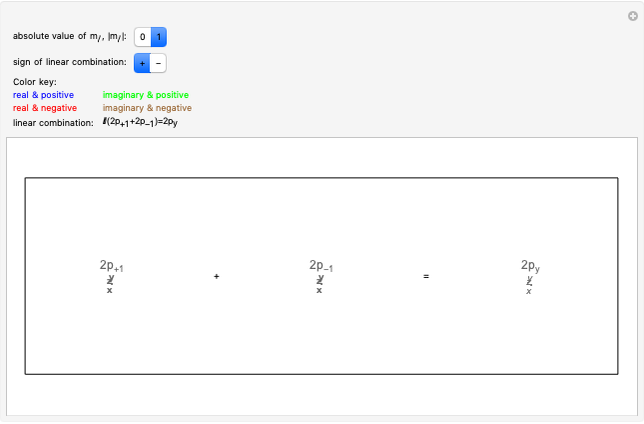 Linear Combinations of p Orbitals
Lisa M. Goss -
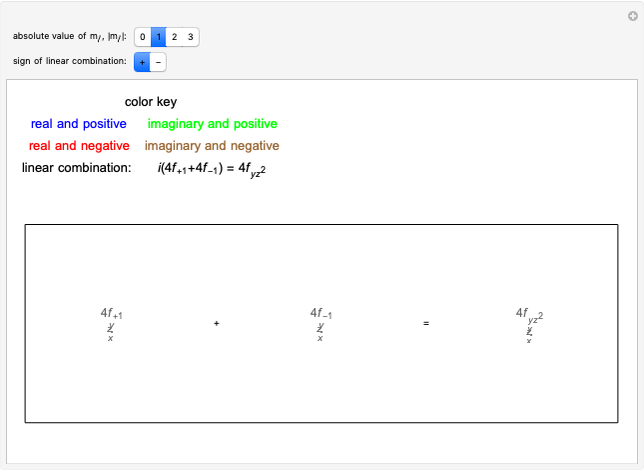 Linear Combinations of f Orbitals
Lisa M. Goss -
 Linear Combinations of d Orbitals
Lisa M. Goss -
Energy and Position Relationships in Simple Harmonic Motion
Lisa M. Goss -
Rovibronic Infrared Spectrum of a Rigid Diatomic Rotor
Lisa M. Goss