Rovibronic Infrared Spectrum of a Rigid Diatomic Rotor


Requires a Wolfram Notebook System
Interact on desktop, mobile and cloud with the free Wolfram Player or other Wolfram Language products.
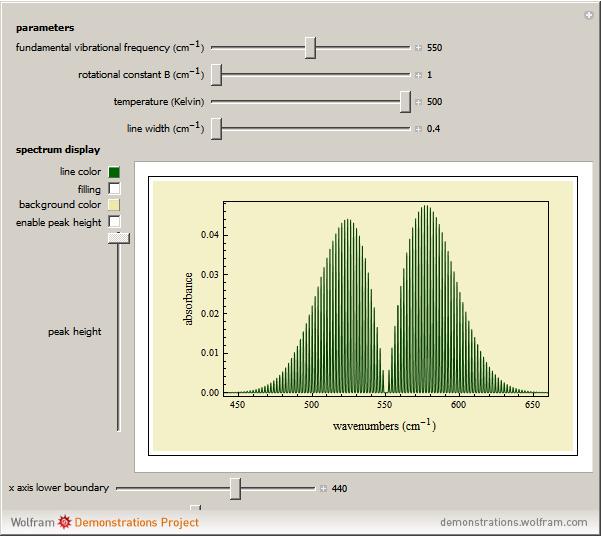
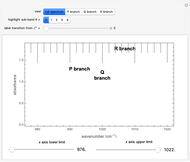
This Demonstration lets you study rotationally-resolved infrared band spectra of the  vibrational transition in diatomic molecules. Due to quantized vibrational and rotational energy levels and the selection rules
  and
and  , allowed transitions result in a highly ordered spectrum consisting of a P branch (
  , smaller wavenumbers) and an R branch (
  , larger wavenumbers) separated by a central gap. Adjacent spectral lines are separated by a spacing of
  , and since line intensities depend on the Boltzmann factor for thermal population and the quantum number
  , each branch monotonically increases and/or decreases. As temperature increases, more lines are observed and the intensities of the lines decrease due to the population being spread over more rotational levels. Interactivity involves the effects of the fundamental vibrational frequency, rotational constant
  , temperature, and line width on the observed spectrum.
Contributed by: Whitney R. Hess and Lisa M. Goss (Idaho State University) (March 2011)
Open content licensed under CC BY-NC-SA
Snapshots
Details
The mathematical expressions for the simulated spectra assume that the diatomic molecule is a rigid rotator, with a small anharmonicity constant ( , zero electronic angular momentum (
 ), and that the rotational constants of the upper and lower states in any given transition are essentially equal (
 ). It is also assumed that only the
  vibrational state is thermally populated, in order to eliminate the presence of "hot bands" and simplify the spectra.
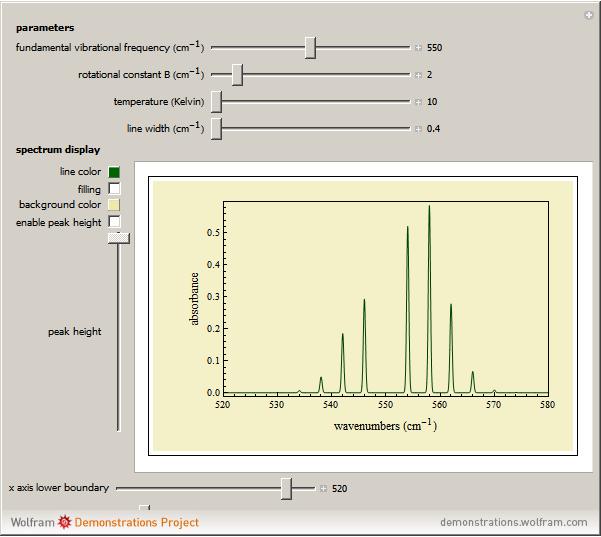
Parameter Controls
The first parameter control lets you vary the fundamental vibrational frequency, which will change the spectrum position along the  axis. The second control manipulates the rotational constant , which increases or decreases line separation. The third control manipulates temperature, and consequently the number of lines observed and their intensities. The last parameter control manipulates the line width, allowing simulation of spectra at various resolutions.
Spectrum Display Controls
These controls should be used to change how the spectrum is viewed. Line color and background color can be chosen and filling under the line can be turned on. Enabling the peak height control allows for the height of the spectrum to be manually increased or decreased. The axis upper and lower boundary controls function to set the range of the axis.
Snapshot 1: spectra acquired at low temperatures are greatly simplified as a result of few populated rotational energy levels
Snapshot 2: spectra acquired at high temperatures have many populated rotational energy levels, resulting in more observed lines
Snapshot 3: spectra acquired of diatomic molecules with a large rotational constant will have larger line separation
Snapshot 4: an increase in line width causes the lines to overlap and resolution to be lost
Snapshot 5: the lines of the P and R branches are completely unresolved due to low resolution
Snapshot 6: with low resolution characteristic of that used in organic chemistry, the band for the vibrational transition is broad and no longer rotationally resolved
References:
P. Atkins and J. de Paula, Physical Chemistry, New York: Oxford University Press, 2006.
G. Herzberg, Molecular Spectra and Molecular Structure I. Spectra of Diatomic Molecules, New Jersey: D. Van Nostrand Company, Inc., 1967.
Permanent Citation
 Rate Equations for a Three-Level Model in Low-Dimensional Exciton Systems
Jessica Alfonsi Rovibronic Spectrum of a Perpendicular Band of a Symmetric Rotor
Whitney R. Hess and Lisa M. Goss Rotation-Vibration Energy Level Transitions of a Diatomic Rotor
Whitney R. Hess and Lisa M. Goss (Idaho State University)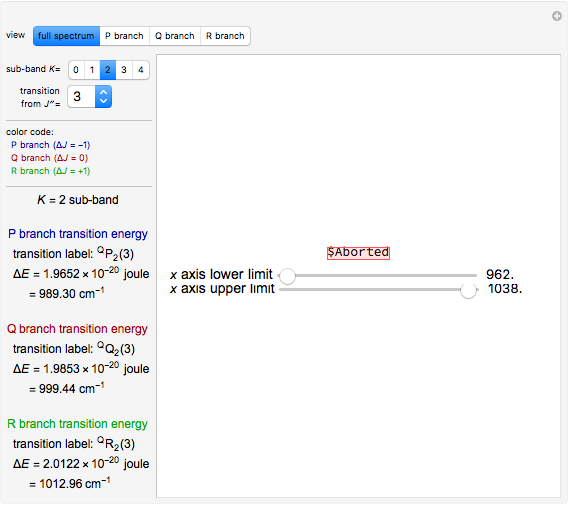 Rotation-Vibration Transitions of a Parallel Band of a Symmetric Rotor
Whitney R. Hess and Lisa M. Goss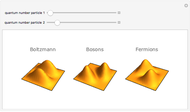 Wave Functions of Identical Particles
Michael Trott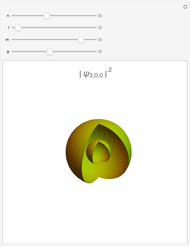 Hydrogen Orbitals
Michael Trott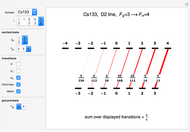 Transition Strengths of Alkali-Metal Atoms
Gianni Di Domenico (Université de Neuchâtel) and Antoine Weis (Université de Fribourg)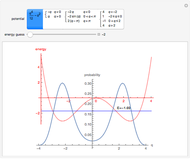 Quantum Well Explorer
Richard Gass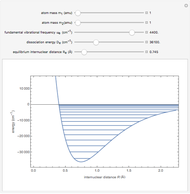 Energy Levels of a Morse Oscillator
S. M. Blinder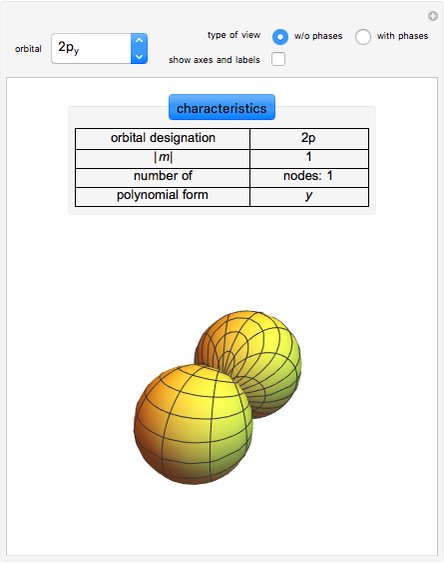 Visualizing Atomic Orbitals
Guenther Gsaller
-
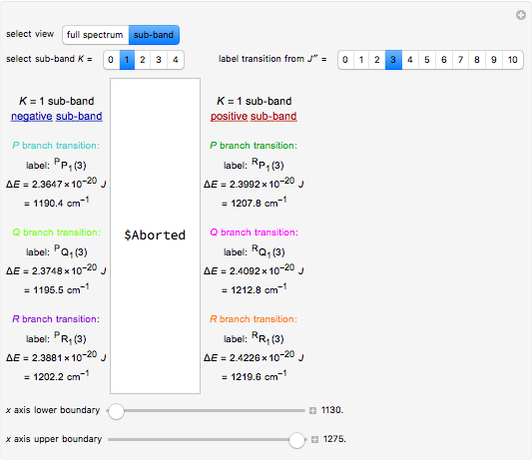 Rotation-Vibration Transitions for a Perpendicular Band of a Symmetric Rotor
Lisa M. Goss -
Rovibronic Spectrum of a Perpendicular Band of a Symmetric Rotor
Lisa M. Goss -
Rotation-Vibration Transitions of a Parallel Band of a Symmetric Rotor
Lisa M. Goss -
 Rovibronic Spectrum of a Parallel Band of a Symmetric Rotor
Lisa M. Goss -
 Lever Rule for the Uranium-Titanium Solid-Liquid Phase Diagram
Lisa M. Goss -
Rotation-Vibration Energy Level Transitions of a Diatomic Rotor
Lisa M. Goss -
 Lever Rule Applied to Phase Diagram for Partially Miscible Liquids
Lisa M. Goss -
 Lever Rule Applied to the Benzene-Toluene Vapor Pressure Diagram
Lisa M. Goss -
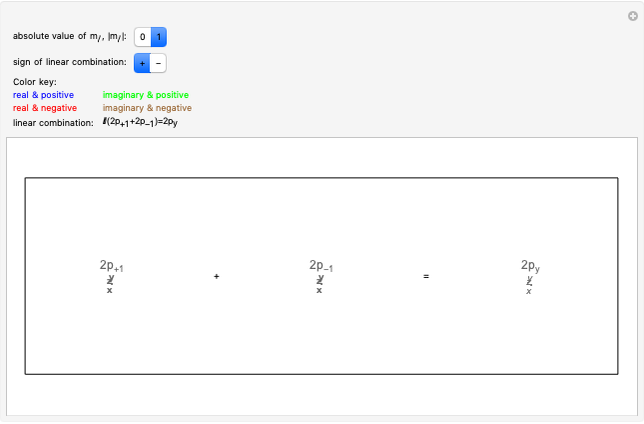 Linear Combinations of p Orbitals
Lisa M. Goss -
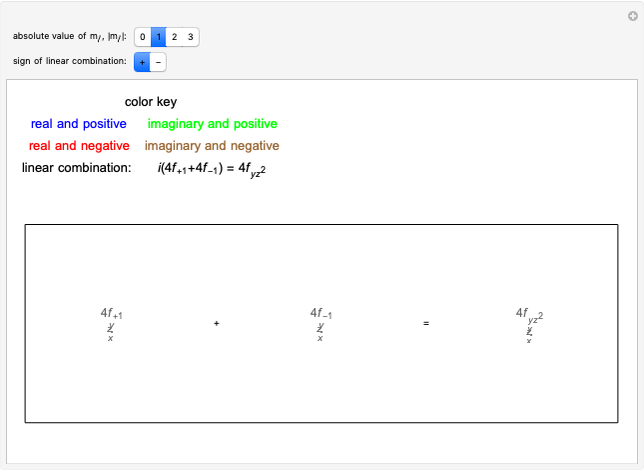 Linear Combinations of f Orbitals
Lisa M. Goss -
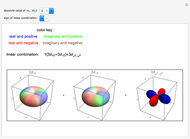 Linear Combinations of d Orbitals
Lisa M. Goss -
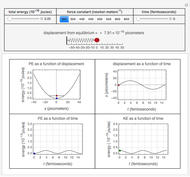 Energy and Position Relationships in Simple Harmonic Motion
Lisa M. Goss -
 Rovibronic Infrared Spectrum of a Rigid Diatomic Rotor
Lisa M. Goss