Steady-State 1D Conduction through a Composite Wall


Requires a Wolfram Notebook System
Interact on desktop, mobile and cloud with the free Wolfram Player or other Wolfram Language products.
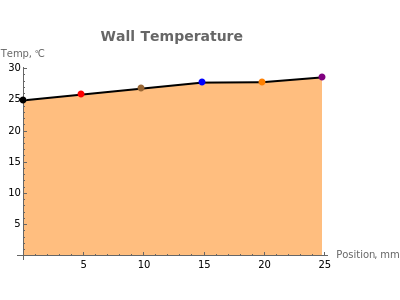
The purpose of this Demonstration is to illustrate the relationship between heat transfer and thermal conductivity  of a material by applying Fourier's law,
  , to plot the temperature
  versus the position
  through the depth of a multilayer wall. You can vary the total heat surface heat flux
  conducted through the multilayer wall and the surface temperature at the far left side of the wall,
  . The wall has a constant cross-sectional area
  in square meters in the
  direction. You can select different materials and their thicknesses for five layers of the wall, denoting
  as the thermal conductivity of layer
  . Given this information, it is possible to determine the temperature profile through the wall, showing the interior temperature at each location.
Contributed by: Sara McCaslin and Fredericka Brown (August 2011)
Open content licensed under CC BY-NC-SA
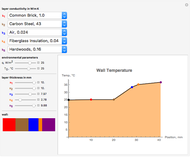
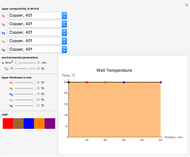
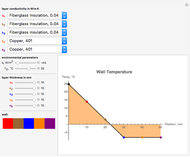
Snapshots


Details
If  is the thermal conductivity of layer
  in W/m K and
  is the thickness of layer
  in m,
in m,  .
.
This Demonstration can investigate the following questions:
If you use a negative value for heat flow, do you expect the temperature on the far side of the wall to be warmer or cooler than  ?
?
Can you verify that steel or copper does not work well as an insulating material?
Do insulating materials have a steep slope on the temperature versus position plot?
What materials make good insulators?
What materials make good conductors?
By changing  , flow rate
  , and material types/thicknesses you can find the answers to these questions.
For more information on conduction through a multilayer isothermal wall, see Engineer's Edge.
Reference
[1] D. Pitts and L. E. Sissom, Schaum's Outline of Heat Transfer, New York: McGraw Hill, 1998.
Permanent Citation
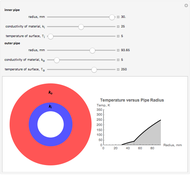 Steady-State Temperature Profile of Two-Layer Pipe
Fredericka Brown and Sara McCaslin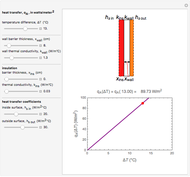 Steady-State Heat Transfer through an Insulated Wall
Mark D. Normand and Micha Peleg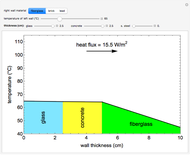 Conduction through a Composite Wall
Mathew L. Williams and Rachael L. Baumann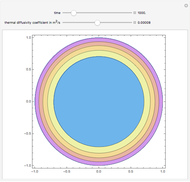 Nonsteady-State Heat Conduction in a Cylinder
Housam Binous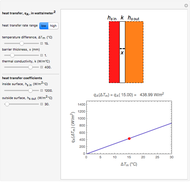 Heat Transfer in a Heat Exchanger
Mark D. Normand, Maria G. Corradini, and Micha Peleg Heat Conduction in Some Standard Solids
Mikhail Dimitrov Mikhailov Transient Heat Conduction with a Nuclear Heat Source
Clay Gruesbeck Heat Diffusion in a Semi-Infinite Region
Brian Vick Thermal Energy
Enrique Zeleny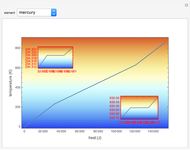 Latent Heats of Fusion and Vaporization
Enrique Zeleny
-
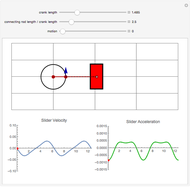 Slider and Crank Mechanism
Fredericka Brown -
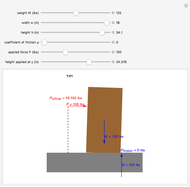 Engineering Dynamics: Tip or Slip?
Fredericka Brown -
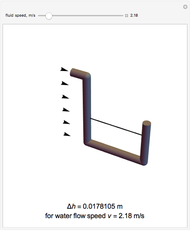 Pitot Tube
Fredericka Brown -
 Steady-State 1D Conduction through a Composite Wall
Fredericka Brown -
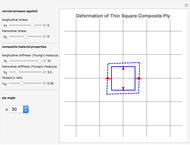 Normal and Shear Coupling for Unidirectional Angle Ply
Fredericka Brown -
Steady-State Temperature Profile of Two-Layer Pipe
Fredericka Brown -
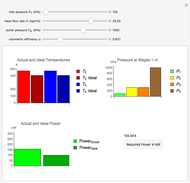 Reciprocating Compressor with an Intercooler
Fredericka Brown -
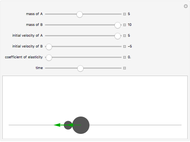 Linear Collisions of Two Disks
Fredericka Brown -
 3D Angular Momentum of a Particle
Fredericka Brown