Stock Market Crossover

Requires a Wolfram Notebook System
Interact on desktop, mobile and cloud with the free Wolfram Player or other Wolfram Language products.
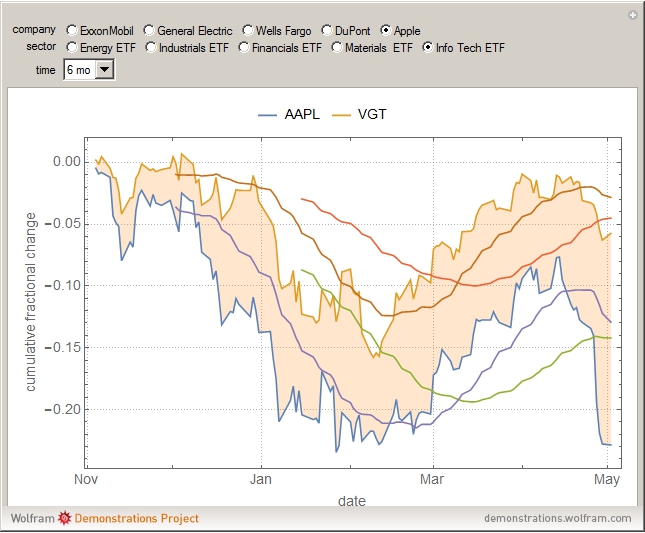
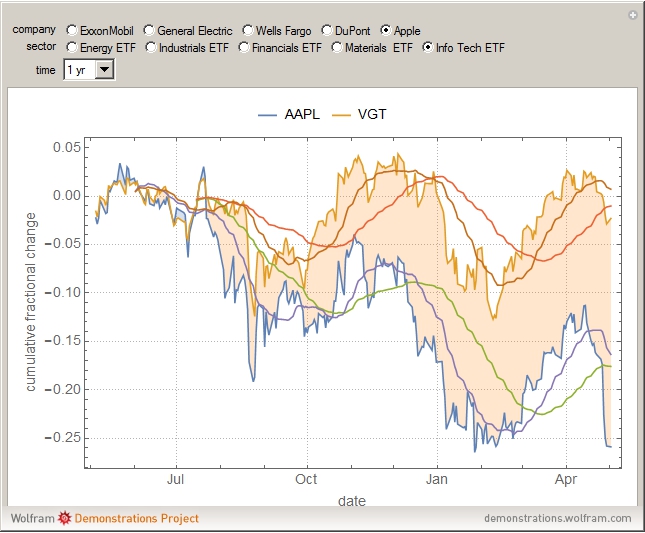
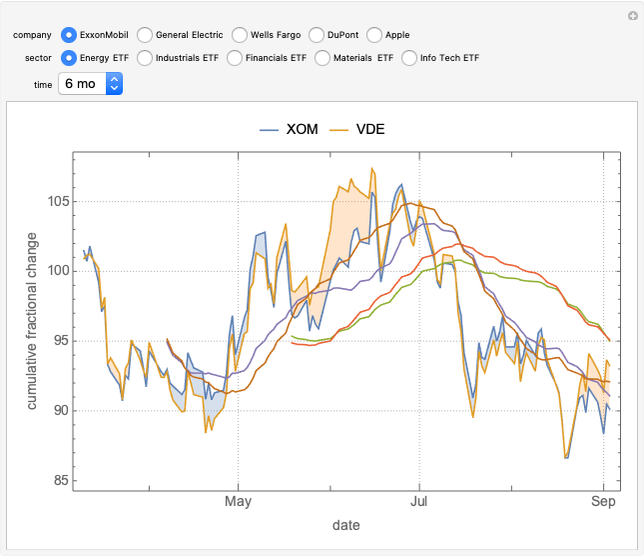
An ETF, or exchange traded fund, is a marketable security that tracks an index, a commodity, bonds, or a basket of assets like an index fund. By owning an ETF, investors get the diversification of an index fund as well as the ability to trade it like a stock on an exchange. This Demonstration plots the cumulative fractional change of a security and its respective Vanguard sector ETF for comparison. 50- and 20-day moving averages are included to show crossovers and short- or long-term market trends.
Contributed by: Andrew Tao and Michael Kelly (May 2016)
Open content licensed under CC BY-NC-SA
Snapshots
Details
Crossovers occur when the value of a security intersects with a stock indicator, such as a 20- or 50-day moving average (MA). Crossovers often indicate a reversal or start of a bullish or bearish trend. A security-indicator crossover may indicate a short-term fluctuation such as when the security crosses above the MA, triggering a buy signal, or when it crosses below the MA, triggering a sell signal. Similarly, an indicator-indicator crossover may indicate a long-term trend, so that the 20-day MA crossing above the 50-day MA may indicate a possible upward trend and a buy signal, while the 20-day MA crossing below the 50-day MA may indicate a possible downward trend and a sell signal.
Permanent Citation
"Stock Market Crossover"
http://demonstrations.wolfram.com/StockMarketCrossover/
Wolfram Demonstrations Project
Published: May 4 2016
 Stock Forecasting
Andrew Tao Expected Returns of the Dow Industrials, Fama-French Model
Jeff Hamrick and Jason Cawley World Bank Data Series Overview
Michael Schreiber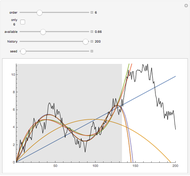 Polynomial Fits of Random Walks
Michael Schreiber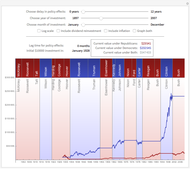 Stock Market Returns by Party
Theodore Gray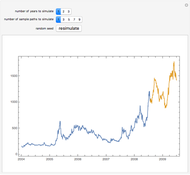 Bootstrapping Credit Default Swap Data
Jeff Hamrick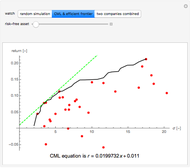 Random Simulation of a Financial Portfolio
Alois Neumann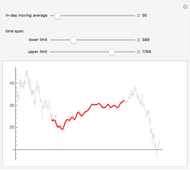 Varying Moving Averages
George Beck Stock Prices of Technology Companies
Eugene Poberezkin Logistic Sigmoid Market Model
Michael Schreiber
-
 Finding Comparative Advantage
Michael Kelly -
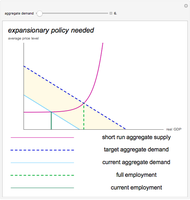 Fiscal Policy Based on Aggregate Demand
Michael Kelly -
 Stock Market Crossover
Michael Kelly -
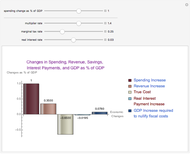 Krugman's Cost Benefit Analysis for Austerity Cuts in Government Spending
Michael Kelly -
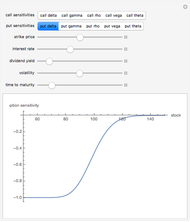 European Option Greeks
Michael Kelly -
 Black-Scholes Option Model
Michael Kelly