Subrange Data View


Requires a Wolfram Notebook System
Interact on desktop, mobile and cloud with the free Wolfram Player or other Wolfram Language products.
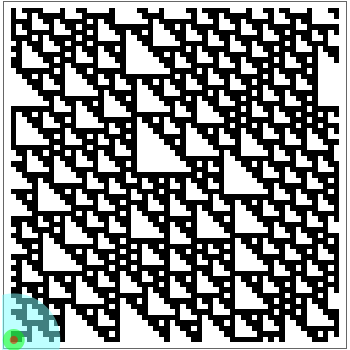
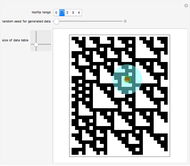
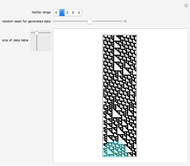
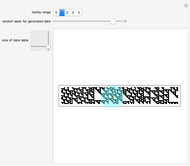
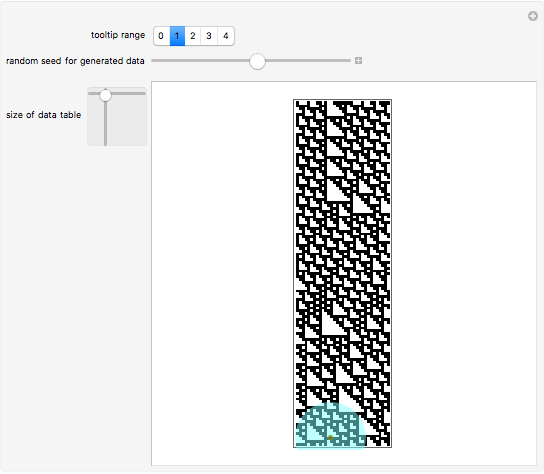
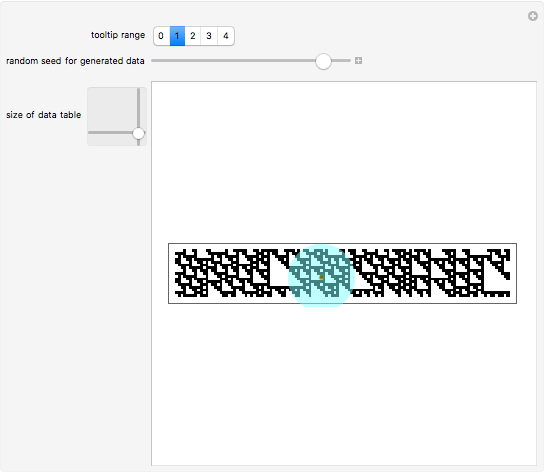
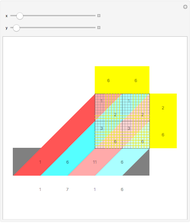
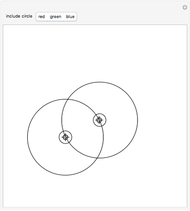
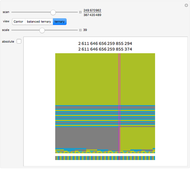
Sometimes it is helpful to see details as well as the big picture. This Demonstration shows a rule 110 cellular automaton evolving from random initial conditions. Subranges of values and a smaller plot are presented by tooltips that appear when your mouse is next to the disks. You can resize the table of example data and modify the range of values shown by the tooltip. The red disk marks the center of the subranges, the green disk indicates the size of the selected subrange, and the cyan disk helps to find the other disks if subranges are relatively small.
Contributed by: Michael Schreiber (March 2011)
Open content licensed under CC BY-NC-SA
Snapshots

Details
detailSectionParagraphPermanent Citation
"Subrange Data View"
http://demonstrations.wolfram.com/SubrangeDataView/
Wolfram Demonstrations Project
Published: March 7 2011
 Decomposition of 2,3 Turing Machine Evolutions
Michael Schreiber State Emphasis for 2,3 Turing Machine 596440
Michael Schreiber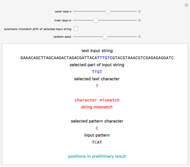 Brute-Force String Matching
Michael Schreiber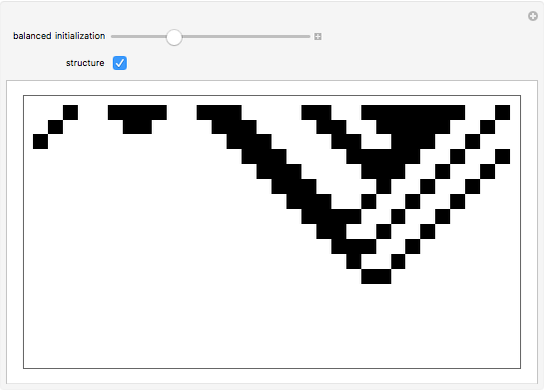 Balanced Annihilation
Michael Schreiber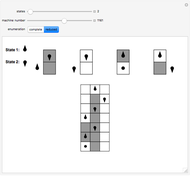 Small Turing Machines with Halting State: Enumeration and Running on a Blank Tape
Fernando Soler-Toscano, Hector Zenil, Jean-Paul Delahaye, and Nicolas Gauvrit The Function Computed by the Wolfram 2,3 Turing Machine
Jesse Nochella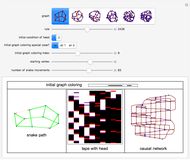 Turing Snakes
Seth J. Chandler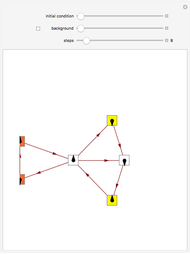 Rule Case Transition Diagrams for the Wolfram 2,3 Turing Machine
Stephen Wolfram and Jesse Nochella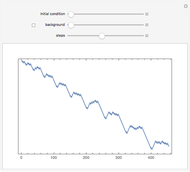 State Sequences in the Wolfram 2,3 Turing Machine
Jesse Nochella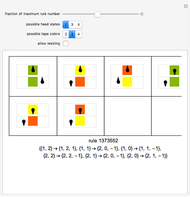 Turing Machine Enumeration
Seth J. Chandler
-
 Ten Year Calendar
Michael Schreiber -
 Spanning Tree of Points on Sphere
Michael Schreiber -
 Simple Three-Letter Cube
Michael Schreiber -
 Arithmetic Sculpture for Addition and Multiplication
Michael Schreiber -
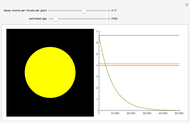 Carbon Dating
Michael Schreiber -
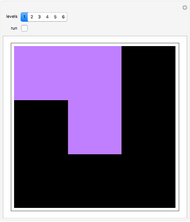
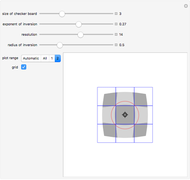 Board Inversion
Michael Schreiber -
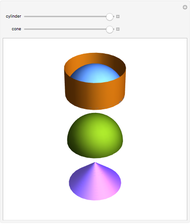 Cylinder Hemisphere Cone
Michael Schreiber -
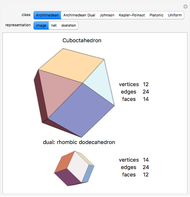 Polyhedron Dual
Michael Schreiber -
 Lattice Multiplication
Michael Schreiber -
 Ultimate Tic-Tac-Toe
Michael Schreiber -
 Keccak Cinema Contemplation
Michael Schreiber -
 Xored Keccak States for Steps in Rounds of SHA-3
Michael Schreiber -
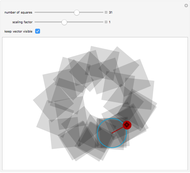 Spirals of Squares
Michael Schreiber -
 Opposite Rotations of Frame Segments
Michael Schreiber -
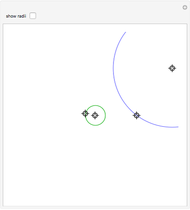 Intersecting Circles
Michael Schreiber -
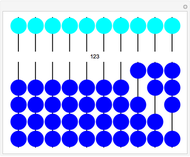 Abacus
Michael Schreiber -
 Doubling a Distance with a Compass
Michael Schreiber -
 The Cantor Sequence with Bits
Michael Schreiber -
 Diffusion-Limited Clogging
Michael Schreiber -
 Marginal Utility Budget Line
Michael Schreiber