The Area Over a Receiver Operating Characteristic (ROC) Curve as an Index of Diagnostic Inaccuracy

Requires a Wolfram Notebook System
Interact on desktop, mobile and cloud with the free Wolfram Player or other Wolfram Language products.
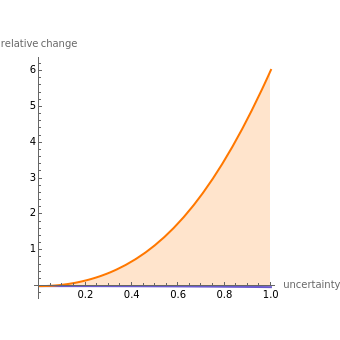
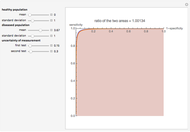
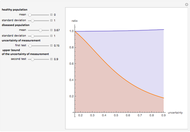
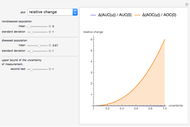
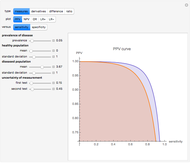
This Demonstration plots the change, the relative change, the rate of change and the relative rate of change of the area under (blue plot) and the area over (orange plot) the receiver operating characteristic (ROC) curve of a diagnostic test as the uncertainty of measurement increases from 0 to a user-defined upper bound. Measures are determined for normally distributed nondiseased and diseased populations for various values of the mean and standard deviation of the populations. A normal distribution of the uncertainty is assumed. The type of plot is selected using the "plot" menu. The five parameters that can be varied using the sliders are given in arbitrary units.
Contributed by: Aristides T. Hatjimihail (March 2011)
(Hellenic Complex Systems Laboratory)
Open content licensed under CC BY-NC-SA
Details
The ROC curves are used in the evaluation of the clinical accuracy of a diagnostic test applied to diseased and nondiseased populations. An ROC curve is a plot of the sensitivity of a test versus 1-specificity. Sensitivity is the fraction of the diseased population with a positive test while specificity is the fraction of the nondiseased population with a negative test. Therefore, the ROC plots the true positive fraction versus the false positive fraction. Furthermore, the area under an ROC curve is used as an index of the diagnostic accuracy of the respective test. The area under the curve decreases as the uncertainty of measurement of the diagnostic test increases [1].
Assuming  is the area under an ROC curve and
 is the area over the ROC curve for an uncertainty of measurement
  , the changes
  and
and  are defined as
  and
and  , the relative changes as
  and
and  , the rates of change as
  and
and  , and the relative rates of change as
  and
and  , respectively.
As  , it can be considered that the area over the ROC curve is an index of diagnostic inaccuracy. In fact, as the plots of this Demonstration show, the relative change, the rate of change and the relative rate of change of the area over an ROC curve versus the uncertainty of measurement are greater than the absolute value of the respective measures of the area under the ROC curve for the same populations.
To the best of the author's knowledge, measures of the area over the ROC curve versus the uncertainty of measurement have not been discussed in the literature except for [2].
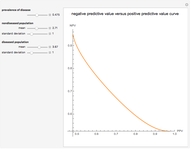
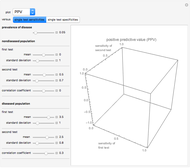
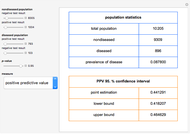
The area over the ROC curve could be used in the evaluation of a diagnostic test as a diagnostic inaccuracy index. For example, in the thumbnail and the snapshots, the population data describes a bimodal distribution of serum glucose on a nondiabetic and a diabetic population [3].
References
[1] A. T. Hatjimihail. "Receiver Operating Characteristic Curves and Uncertainty of Measurement" from the Wolfram Demonstrations Project—A Wolfram Web Resource. demonstrations.wolfram.com/ReceiverOperatingCharacteristicCurvesAndUncertaintyOfMeasure.
[2] A. T. Hatjimihail. "Uncertainty of Measurement and Areas Over and Under the ROC Curves" from the Wolfram Demonstrations Project—A Wolfram Web Resource. demonstrations.wolfram.com/UncertaintyOfMeasurementAndAreasOverAndUnderTheROCCurves.
[3] T.-O. Lim, R. Bakri, Z. Morad and M. A. Hamid, "Bimodality in Blood Glucose Distribution—Is It Universal?," Diabetes Care, 25(12), 2002 pp. 2212–2217. doi:10.2337/diacare.25.12.2212.
Snapshots
Permanent Citation
