The Effect of Holding Period on Real Estate Investment Return


Requires a Wolfram Notebook System
Interact on desktop, mobile and cloud with the free Wolfram Player or other Wolfram Language products.
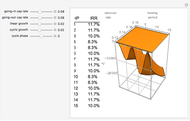
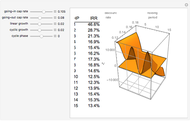
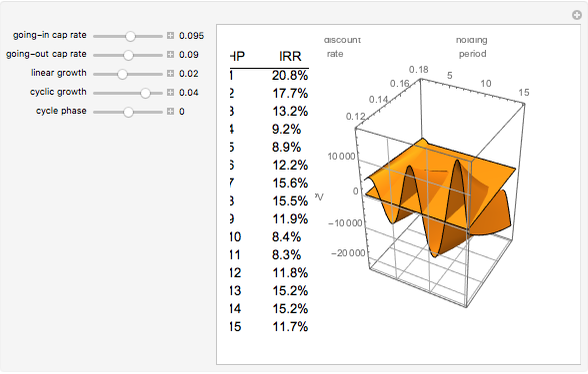
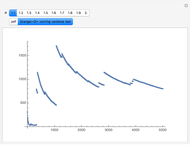
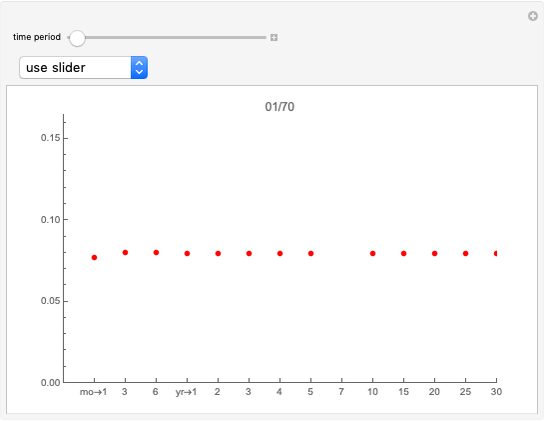
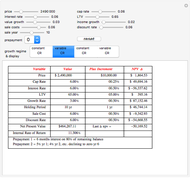
A critical variable in investment return that is rarely modeled is the length of the holding period. While this is generally true of all investments with uncertain returns over time, in a real estate setting there is an important relationship between profitability and the change in both the discount and capitalization rates over the holding period. The model here employs an oscillating business cycle with upward drift, something common to capitalistic economies with a positive interest rate. The table shows the internal rate of return (IRR) for different holding periods during the cycle(s). Exiting at points where the plot is above the plane represents positive net present values. Cycle phase can be manipulated for different cycle extremes. An arbitrary initial cash flow of $5,000 is used as a starting point. This does not affect the shape of the plot ($1 could be used), serving only to make realistic the NPVs shown on its axis.
Contributed by: Roger J. Brown (March 2011)
Reproduced by permission of Academic Press from Private Real Estate Investment ©2005
Open content licensed under CC BY-NC-SA
Snapshots


Details
This is an illustration of the oft-repeated phrase, "Timing is everything". The ideal direction of capitalization rate movement during a holding period is down because of the inverse relationship between capitalization rate and value. The zero plane, where NPV = 0, is set by choosing the discount rate on the axis as the hurdle rate in the NPV calculation. Internal rates of return higher than that chosen rate produce positive net present values where the plot is above the plane; the opposite is true for IRRs less than the hurdle rate where the plot appears beneath the surface of the plane (hence the vernacular "under water"). Very dramatic outcomes appear (in both directions) when going-in and going-out cap rates are at their opposite extremes. One of these extremes represents the end of a "bubble" and portends disaster for the greater fools who were the last to board the bus.
More information is available in Chapter Three of Private Real Estate Investment and at mathestate.com.
R. J. Brown, Private Real Estate Investment: Data Analysis and Decision Making, Burlington, MA: Elsevier Academic Press, 2005.
Permanent Citation
"The Effect of Holding Period on Real Estate Investment Return"
http://demonstrations.wolfram.com/TheEffectOfHoldingPeriodOnRealEstateInvestmentReturn/
Wolfram Demonstrations Project
Published: March 7 2011
 Explaining Real Estate Price Bubbles
Roger J. Brown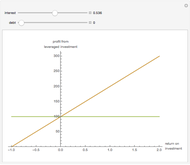 Investment Leverage Effect
Michael Schreiber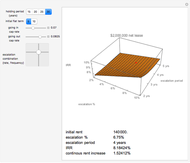 Net Lease Economics
Roger J. Brown Risk, Ownership, and Control
Roger J. Brown Value Added Growth Model
Roger J. Brown Land Use Regulation and Municipal Utility
Roger J. Brown Real Options
Roger J. Brown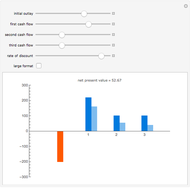 Net Present Value
Fiona Maclachlan Two-Asset Markowitz Feasible Set
Jim R Larkin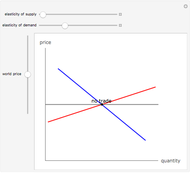 Gains from Trade
Fiona Maclachlan
-
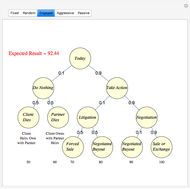 Dissolving Partnerships
Roger J. Brown -
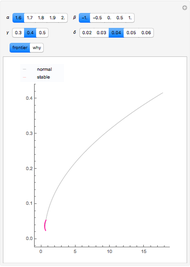 Forming the Efficient Frontier When Returns Are Non-Normal
Roger J. Brown -
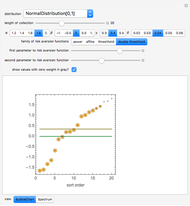 Spectral Measures
Roger J. Brown -
 Granger-Orr Running Variance Test
Roger J. Brown -
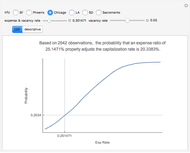 Capitalization Rate Probability
Roger J. Brown -
Net Lease Economics
Roger J. Brown -
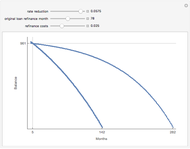 The Refinance Decision
Roger J. Brown -
 True Cost of Variable Rate Mortgage Funds
Roger J. Brown -
 Term Structure of Interest Rates
Roger J. Brown -
 Generalized Central Limit Theorem
Roger J. Brown -
 Inflation-Adjusted Yield
Roger J. Brown -
 Simulating the IRR
Roger J. Brown -
Real Options
Roger J. Brown -
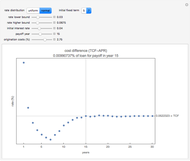
 The Price-Terms Tradeoff
Roger J. Brown -
 Fitting an Elephant
Roger J. Brown -
 Solving the Subprime Loan Problem
Roger J. Brown -
 Why Location Matters: The Bid Rent Curve
Roger J. Brown -
Explaining Real Estate Price Bubbles
Roger J. Brown -
Value Added Growth Model
Roger J. Brown -
 Connecting the CDF and the PDF
Roger J. Brown