Velocity versus Displacement Plots in Uniformly Accelerated Linear Motion
Initializing live version


Requires a Wolfram Notebook System
Interact on desktop, mobile and cloud with the free Wolfram Player or other Wolfram Language products.
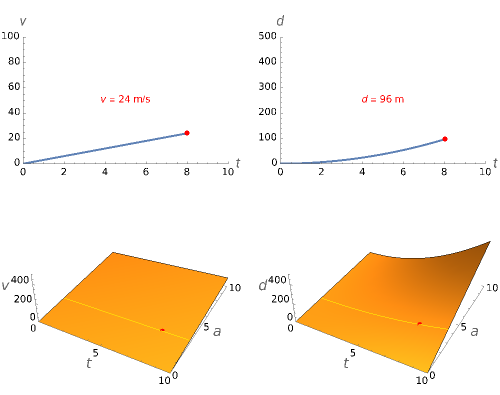
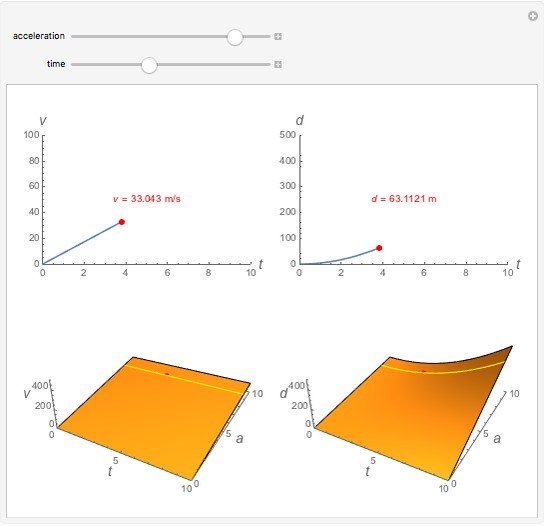
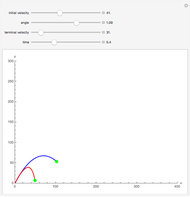
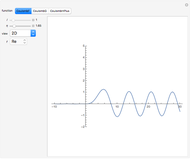
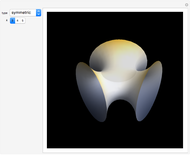
The plots show the variation of velocity and distance as functions of time for uniformly accelerated motion. The red points show the velocity and the distance traveled for a particular value of time. The upper plots show velocity and distance as a function of time, for a fixed acceleration. In the 3D plots, the acceleration is varied too; then, the surfaces can be seen as the set of all 2D curves.
Contributed by: Enrique Zeleny (March 2011)
Open content licensed under CC BY-NC-SA
Snapshots


Details
detailSectionParagraph
Related Demonstrations
More by Author
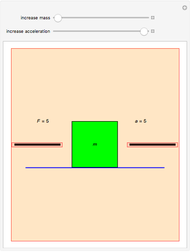
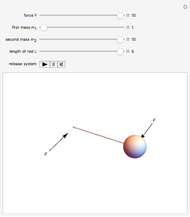 Motion of a Dumbbell Acted on by Constant Forces
Sarah Lichtblau 3D Projectile Motion
Robert Lancaster Motion on Surface of the Earth: Coriolis Force
Enrique Zeleny Astronaut Training Centrifuge
Enrique Zeleny Spinning Mass with Variable Radius
Enrique Zeleny Conic Pendulum
Enrique Zeleny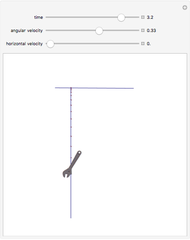 Rotation and Translation of a Rigid Body
Enrique Zeleny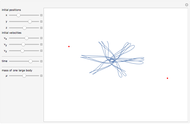 Restricted Three-Body Problem in 3D
Enrique Zeleny Mass Motion under a Variable Force
Enrique Zeleny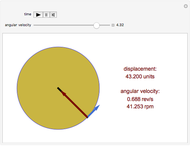 Uniform Circular Motion
Enrique Zeleny
-
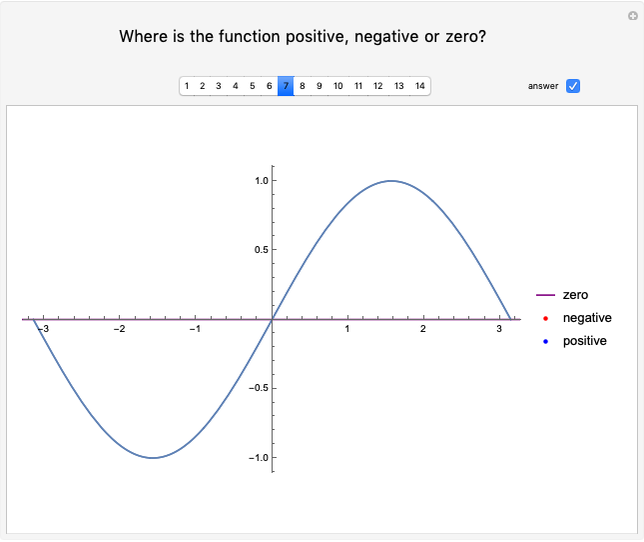 Sign of a Function
Enrique Zeleny -
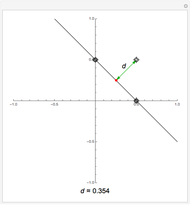 Length of the Perpendicular from a Point to a Straight Line
Enrique Zeleny -
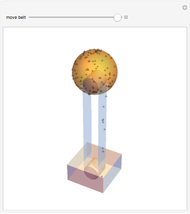 Van de Graaff Generator
Enrique Zeleny -
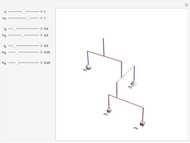 Equilibrium of a Suspended Mobile
Enrique Zeleny -
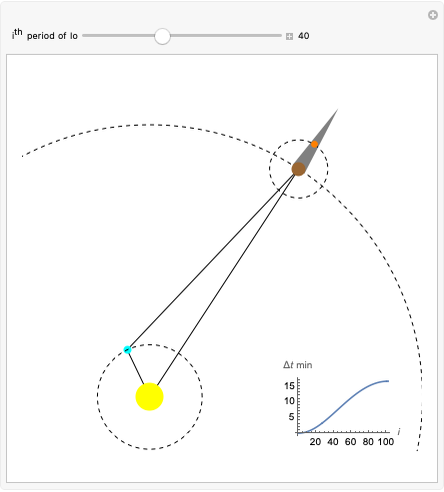 Rømer's Measurement of the Speed of Light
Enrique Zeleny -
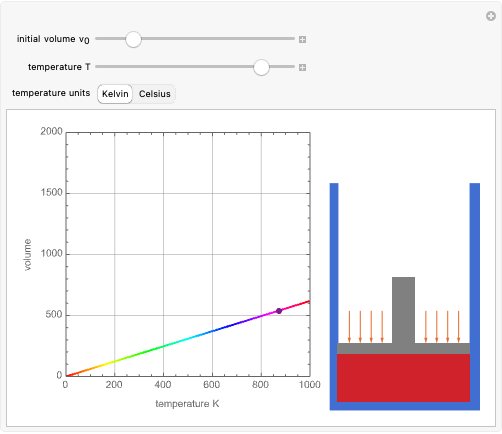 Charles's Law
Enrique Zeleny -
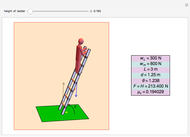 Forces Acting on a Ladder
Enrique Zeleny -
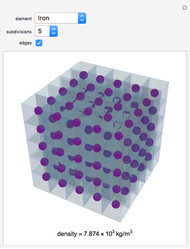 Density
Enrique Zeleny -
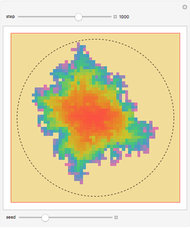 Tumor Growth Model
Enrique Zeleny -
 Newton's Second Law
Enrique Zeleny -
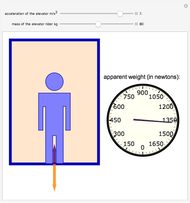 Weight of a Person Riding in an Elevator
Enrique Zeleny -
 Active Shock Absorbers
Enrique Zeleny -
 Bragg's Law
Enrique Zeleny -
 Projectile with Air Drag
Enrique Zeleny -
 Coulomb Wavefunctions
Enrique Zeleny -
 Jorge-Meeks K-Noids
Enrique Zeleny -
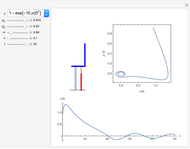
 Motion of a Parachuter
Enrique Zeleny -
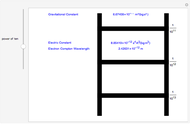 Asimov's Ladder of Physical Constants
Enrique Zeleny -
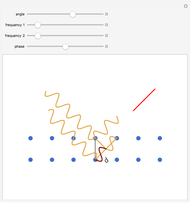
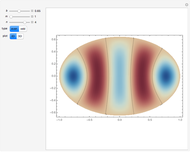 Solutions of the Elliptic Membrane Problem
Enrique Zeleny -
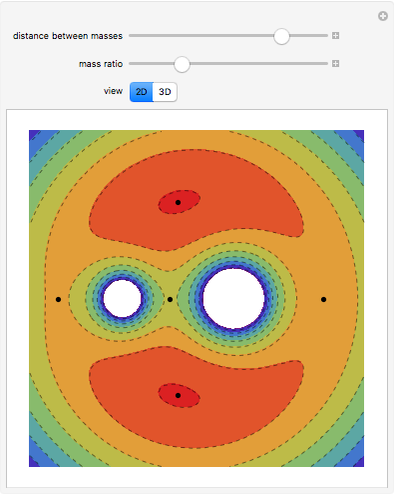 Lagrange Points
Enrique Zeleny