Visualizing Correlations

Requires a Wolfram Notebook System
Interact on desktop, mobile and cloud with the free Wolfram Player or other Wolfram Language products.
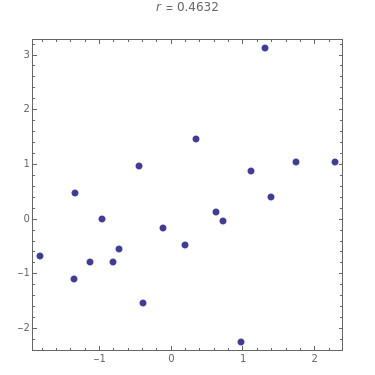
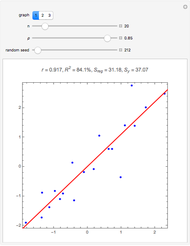
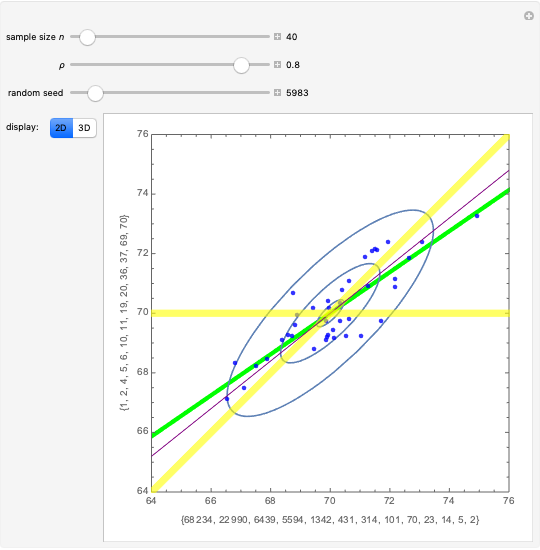
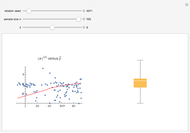
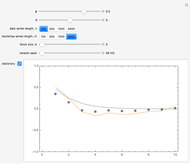
For dimension two, we have either the bivariate normal with unit variances, mean zero, and correlation parameter  , or, in the contaminated case (with a 10% probability), the observation is replaced with one from the same distribution but multiplied by 3. The contaminated distribution is sometimes used to describe non-normal data with a higher proportion of outliers than the normal. The estimated correlation
  is shown and reflects the pattern seen in the data, but it may not be an accurate estimator of
  for small
  even in the normal case. Increasing
  increases the accuracy of the estimator
  . If
. If  is kept fixed, the variability of the estimator
  decreases as the absolute magnitude of
  is increased. This is seen by varying the seed and then experimenting with different
  . As we zoom out, our perception may spuriously suggest that the association between the variables increases. Using the contaminated normal distribution increases the variability in our estimate
  and the likelihood of an apparent spurious association when
  .
.
Contributed by: Ian McLeod (March 2011)
Open content licensed under CC BY-NC-SA
Snapshots
Details
In the bivariate normal case, this Demonstration provides a dynamic and more accurate visualization of figure 4.5 in [1]. The illusion that the degree of association increases when we zoom out was discussed in [2]. The contaminated normal distribution was proposed as a realistic model for outliers in [3].
[1] D. S. Moore, The Basic Practice of Statistics, New York: W. H. Freeman and Company, 2010.
[2] W. S. Cleveland, P. Diaconis, and R. McGill, "Variables on Scatterplots Look More Highly Correlated When the Scales Are Increased," Science, 216(4550), 1982 pp. 1138–1141.
[3] J. W. Tukey, "A Survey of Sampling from Contaminated Distributions," Contributions to Probability and Statistics (I. Olkin, ed.), Stanford: Stanford University Press, 1960 pp. 448–485.
Permanent Citation
