Best Effort Global Warming Trajectories

Requires a Wolfram Notebook System
Interact on desktop, mobile and cloud with the free Wolfram Player or other Wolfram Language products.
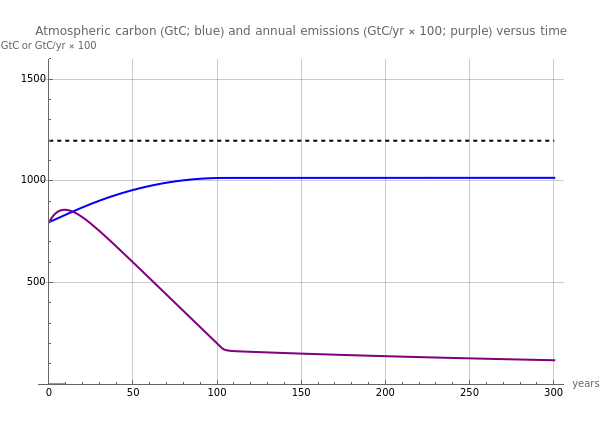
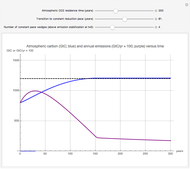
This is a "what if" tool for global warming policy makers. The policy contains just two parameters: the approximate number of (transition) years needed by the world to firmly decrease its annual carbon emissions, and the maximum annual emission reduction effort after that time, expressed in terms of Pacala–Socolow "wedges". Here "effort" is the additional emission reduction effort after all increases of future energy demands have already been stabilzed by carbon-free technologies. (So the Pacala–Socolow seven-wedge strategy is an immediate strategy of zero transitions/zero wedges for the next 50 years).
[more]
Contributed by: Harvey Lam (December 2007)
(Princeton University)
Open content licensed under CC BY-NC-SA
Snapshots
Permanent Citation
"Best Effort Global Warming Trajectories"
http://demonstrations.wolfram.com/BestEffortGlobalWarmingTrajectories/
Wolfram Demonstrations Project
Published: December 18 2007
