Relation of Diagnostic Accuracy Measures

Requires a Wolfram Notebook System
Interact on desktop, mobile and cloud with the free Wolfram Player or other Wolfram Language products.
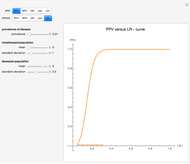
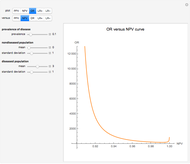
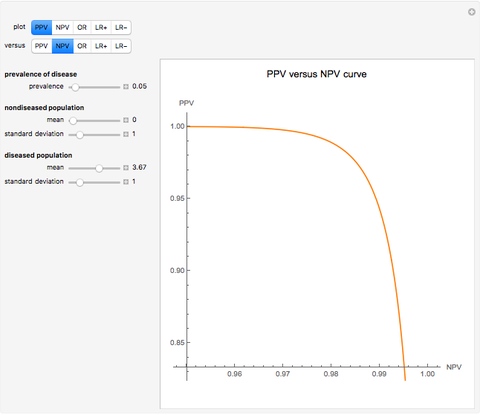
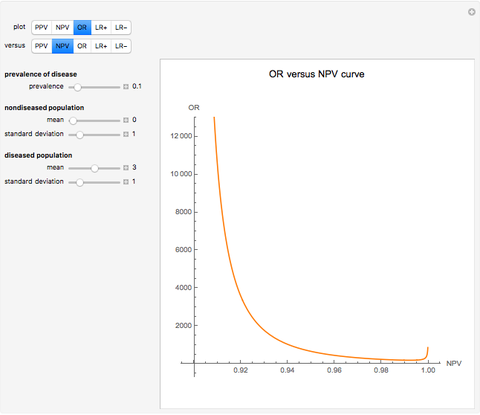
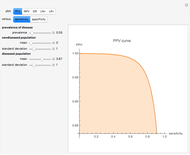
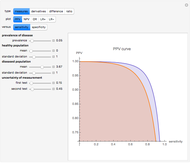
This Demonstration examines the relation of pairs of accuracy measures of diagnostic tests applied on normally distributed nondiseased and diseased populations. This is done for differing prevalence of the disease, taking into account the means and standard deviations of the populations. The means and standard deviations are expressed in arbitrary units. The measures considered are the positive predictive value ("PPV"), the negative predictive value ("NPV"), the (diagnostic) odds ratio ("OR"), the likelihood ratio for a positive result ("LR+") and the likelihood ratio for a negative result ("LR-"). The measures can be selected by clicking the respective "plot" and "versus" buttons.
Contributed by: Theodora Chatzimichail and Aristides T. Hatjimihail (May 2018)
(Hellenic Complex Systems Laboratory)
Open content licensed under CC BY-NC-SA
Snapshots


Details
These measures of the clinical accuracy of a diagnostic test applied to a diseased and a nondiseased population can be calculated as functions of the sensitivity and the specificity of the test. Sensitivity is the fraction of the diseased population with a positive test result, while specificity is the fraction of the nondiseased population with a negative test result. If we denote by  the sensitivity,
  the specificity and
  the prevalence, we have:
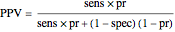 ,
,
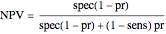 ,
,
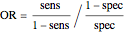 ,
,
 ,
,
 .
.
Given a diseased and a nondiseased population, the specificity can be defined as a function of sensitivity; therefore, we can generate the parametric plots of any pair of the diagnostic accuracy measures.
To the best of our knowledge, with the exception of the pair PPV and NPV [1, 2], the relation of any other pair of the given diagnostic accuracy measures has not been discussed in the literature.
In the thumbnail, the population data describes a bimodal distribution of serum glucose measurements in nondiabetic and diabetic populations [3].
This Demonstration is an extended version of another Demonstration [2], first published in 2015, and is appropriate as an educational tool for medical students and as an exploratory research tool in diagnostic accuracy studies.
References
[1] S.-Y. Shiu and C. Gatsonis, "The Predictive Receiver Operating Characteristic Curve for the Joint Assessment of the Positive and Negative Predictive Values," Philosophical Transactions of the Royal Society A: Mathematical, Physical and Engineering Sciences, 366(1874), 2008 pp. 2313–2333. doi:10.1098/rsta.2008.0043.
[2] T. Chatzimichail. "Correlation of Positive and Negative Predictive Values of Diagnostic Tests" from the Wolfram Demonstrations Project—A Wolfram Web Resource. demonstrations.wolfram.com/CorrelationOfPositiveAndNegativePredictiveValuesOfDiagnostic.
[3] T.-O. Lim, R. Bakri, Z. Morad and M. A. Hamid, "Bimodality in Blood Glucose Distribution: Is It Universal?," Diabetes Care, 25(12), 2002 pp. 2212–2217. doi:10.2337/diacare.25.12.2212.
Permanent Citation
 Analysis of Diagnostic Accuracy Measures
Theodora Chatzimichail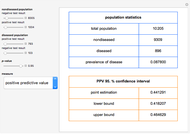 Calculation of Diagnostic Accuracy Measures
Theodora Chatzimichail and Aristides T. Hatjimihail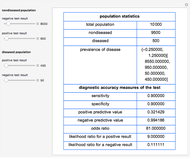 Calculator for Diagnostic Accuracy Measures
Theodora Chatzimichail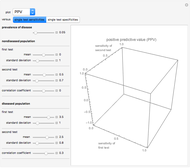 Analysis of Diagnostic Accuracy Measures for Two Combined Diagnostic Tests
Theodora Chatzimichail and Aristides T. Hatjimihail (Aristeidis T. Chatzimichail) Correlation of Positive and Negative Predictive Values of Diagnostic Tests
Theodora Chatzimichail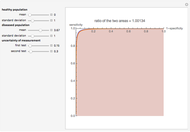 Receiver Operating Characteristic Curves and Uncertainty of Measurement
Aristides T. Hatjimihail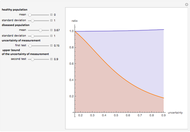 Uncertainty of Measurement and Areas Over and Under the ROC Curves
Aristides T. Hatjimihail (Hellenic Complex Systems Laboratory)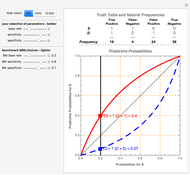 The Discriminatory Power of Diagnostic Information from Discrete Medical Tests
John Fountain and Philip Gunby Measuring Pulmonary Capacity
Enrique Zeleny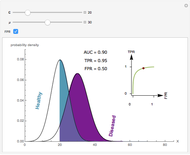 How Receiver Operating Characteristic Curves Work
Ian McLeod
-
Calculation of Diagnostic Accuracy Measures
Aristides T. Hatjimihail -
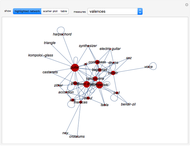 Network of Musical Instruments for Rhythm Accompaniment
Aristides T. Hatjimihail -
 Relation of Diagnostic Accuracy Measures
Aristides T. Hatjimihail -
Analysis of Diagnostic Accuracy Measures for Two Combined Diagnostic Tests
Aristides T. Hatjimihail -
 Uncertainty of Measurement and Diagnostic Accuracy Measures
Aristides T. Hatjimihail -
Receiver Operating Characteristic Curves and Uncertainty of Measurement
Aristides T. Hatjimihail -
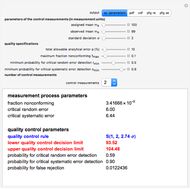 Tool for Quality Control Design and Evaluation
Aristides T. Hatjimihail -
Analysis of Diagnostic Accuracy Measures
Aristides T. Hatjimihail -
Uncertainty of Measurement and Areas Over and Under the ROC Curves
Aristides T. Hatjimihail