Constant Elasticity of Substitution (CES) for Marshallian and Hicksian Demand Functions

Requires a Wolfram Notebook System
Interact on desktop, mobile and cloud with the free Wolfram Player or other Wolfram Language products.
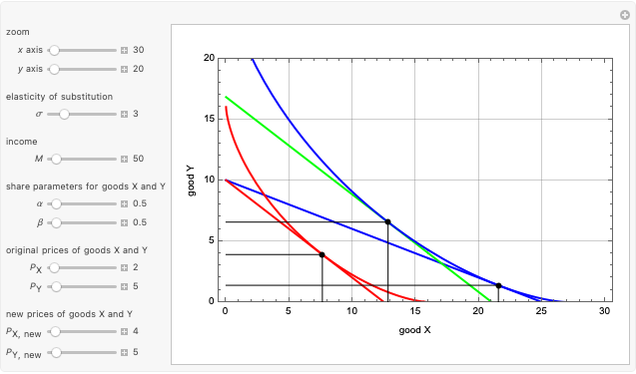
This Demonstration shows the relationships of iso-utility and iso-expenditures for the goods  and
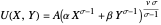
and  in the constant elasticity of substitution (CES) formulation for Marshallian and Hicksian levels of consumption. We consider both compensated and uncompensated income. Let
  and
and  be the number of units of the goods.


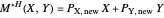


Marshallian consumption 2 (red curve and red line): maximization of  with optimal consumption
  ,
,  subject to uncompensated income
 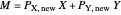 , where
  and
and  are the changed prices. (January 2023)
Contributed by: Carlos Angulo
Open content licensed under CC BY-NC-SA
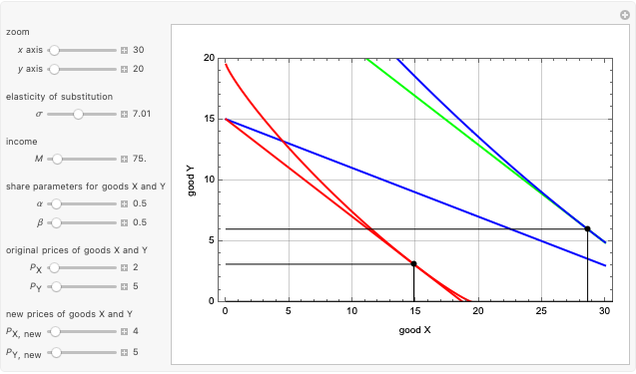
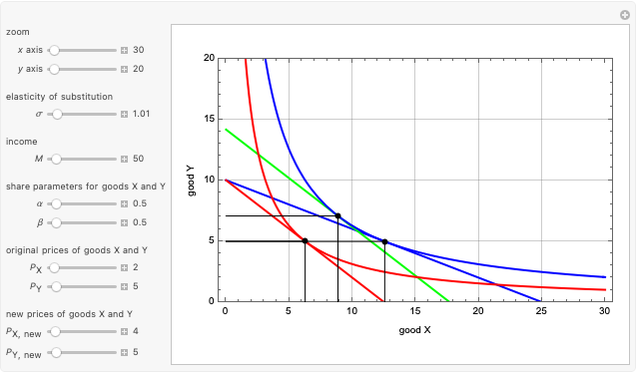
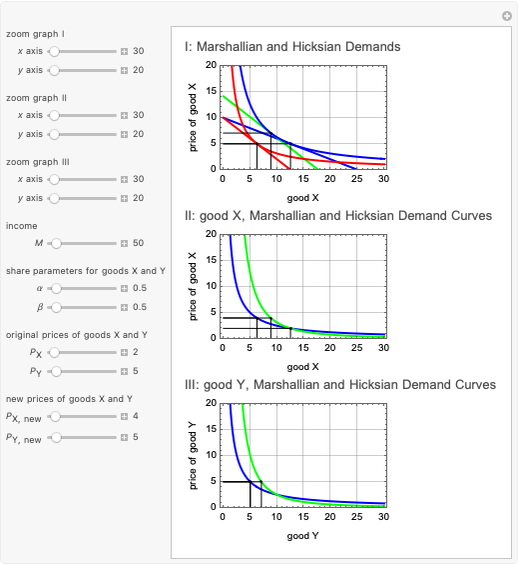
Snapshots


Details
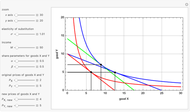
This Demonstration is based on [1], which develops further mathematical analysis from an idea in [2]. The purpose of this Demonstration is to explore how changes in the system parameters lead to changes in the equilibrium states. Hicksian substitution and income effects are represented in the following plots: (1) blue curve and blue line (original Marshallian consumption); (2) red curve and red line (final Marshallian consumption); and (3) blue curve and green line (Hicksian consumption).
References
[1] C. Angulo, "Creation of Wolfram Visualisation Tools for Microeconomic Pedagogy in Comparative Statics," Undergraduate Research Support Scheme research paper, University of Warwick, UK, forthcoming.
[2] K. Sydsæter, P. Hammond, A. Strøm and A. Carvajal, Essential Mathematics for Economic Analysis, 6th ed., Hoboken, NJ: Pearson, 2021.
Permanent Citation
 Cobb-Douglas Formulation of Marshallian and Hicksian Demand Functions
umption 2 (red curve and red line): maximization of U(X,Y) with optimal consumption X^*F, Y^*F subject to uncompensated income M=P_X,?new X+P_Y,?new Y, where P_X,?new and P_Y,?new are the changed prices.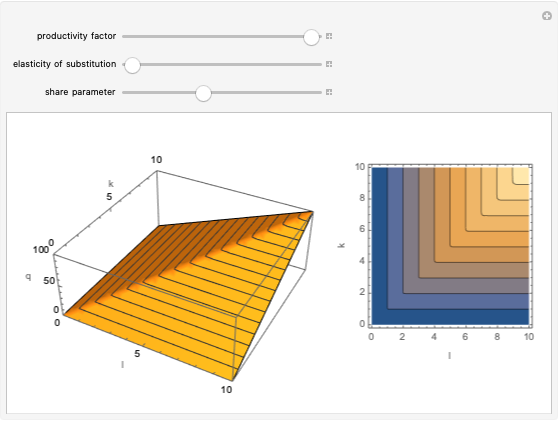 Constant Elasticity of Substitution Production
Kevin Balch and Seth J. Chandler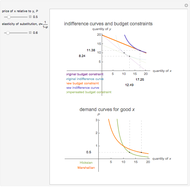 Income and Substitution Effects
William J. Polley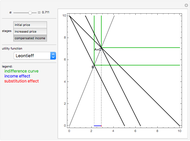 Income and Substitution Effects with Different Utility Functions
Massimiliano Landi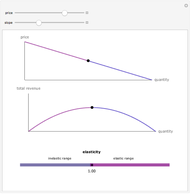 Elasticity, Total Revenue, and the Linear Demand Curve
Fiona Maclachlan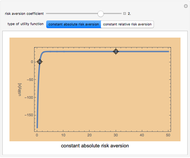 Constant Risk Aversion Utility Functions
Seth J. Chandler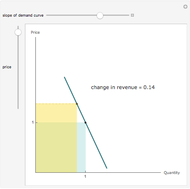 Revenue and Elasticity
Fiona Maclachlan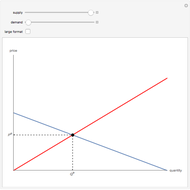 Supply and Demand
Fiona Maclachlan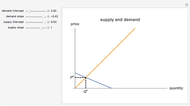 Basic Supply and Demand
Mark Gillis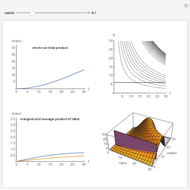 An Example of a Production Function
Javier Puértolas