Adiabatic Expansion and Compression of an Ideal Gas


Requires a Wolfram Notebook System
Interact on desktop, mobile and cloud with the free Wolfram Player or other Wolfram Language products.
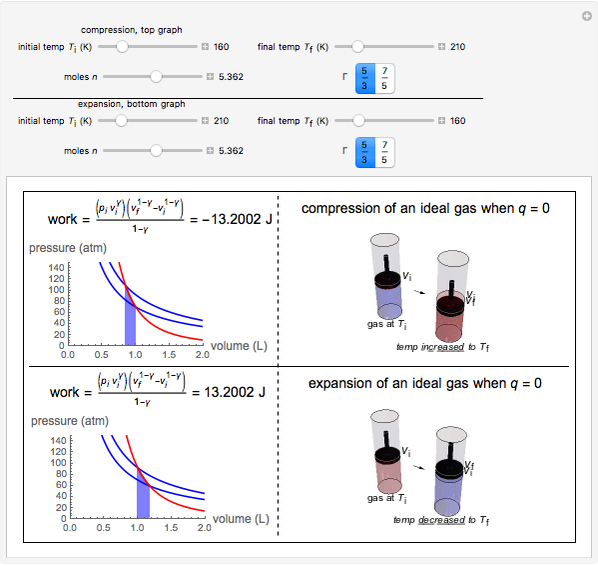
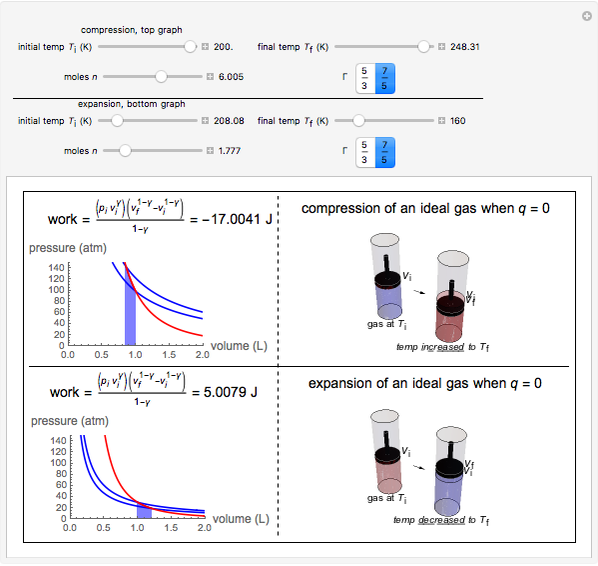
This Demonstration shows adiabatic compression/expansions of an ideal gas, a frequently invoked thermodynamic process (e.g., in a Carnot cycle). Each graphic displays three curves. The two blue curves represent the isotherms of the initial and final temperature; the red line is the adiabatic curve.
[more]


Contributed by: Blair Winograd (June 2015)
Open content licensed under CC BY-NC-SA
Snapshots


Details
Reference
[1] P. W. Atkins and L. Jones, Chemical Principles: The Quest for Insight, New York: W. H. Freeman, 1999.
Permanent Citation
"Adiabatic Expansion and Compression of an Ideal Gas"
http://demonstrations.wolfram.com/AdiabaticExpansionAndCompressionOfAnIdealGas/
Wolfram Demonstrations Project
Published: June 10 2015
 Isobaric Compression and Expansion of an Ideal Gas
Blair Winograd Reversible and Irreversible Isothermal Expansion of an Ideal Gas
Blair Winograd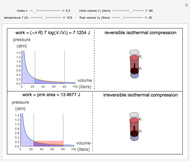 Work Done in Reversible and Irreversible Compression of an Ideal Gas
Blair Winograd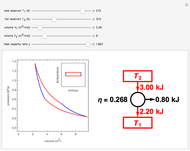 Carnot Cycle on Ideal Gas
S. M. Blinder Reversible and Irreversible Expansion or Compression Work
Rachael L. Baumann Compressed-Gas Spray
Rachael L. Baumann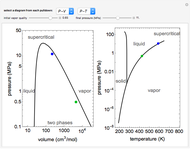 Adiabatic Compression of Water in Vapor-Liquid Equilibrium (VLE)
Rachael L. Baumann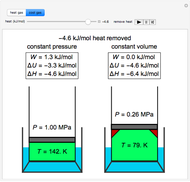 Temperature Changes in an Ideal Gas
Rachael L. Baumann Van der Waals' Equation of State for a Non-Ideal Gas
Zach Heuman (Boise State University) Compressing Ideal Fermi and Bose Gases at Low Temperatures
Tad Hogg
-
 Simulating Gas Exchange in a Model of Pulmonary Fibrosis
Blair Winograd -
Reversible and Irreversible Isothermal Expansion of an Ideal Gas
Blair Winograd -
 Adiabatic Expansion and Compression of an Ideal Gas
Blair Winograd -
Work Done in Reversible and Irreversible Compression of an Ideal Gas
Blair Winograd -
Isobaric Compression and Expansion of an Ideal Gas
Blair Winograd