Country Statistics over Time


Requires a Wolfram Notebook System
Interact on desktop, mobile and cloud with the free Wolfram Player or other Wolfram Language products.
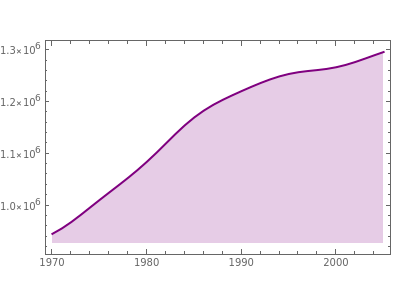
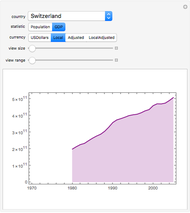
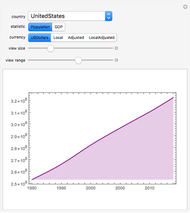
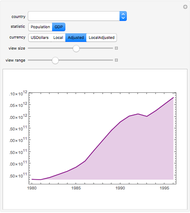
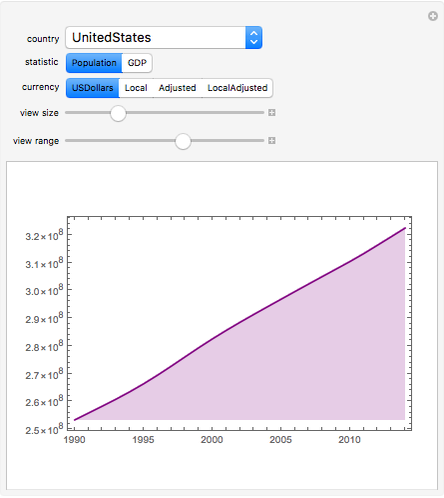
This Demonstration allows for the visualization of population and GDP figures over time for any country in the CountryData database. Choose a country from the drop-down box and select a statistic to view (Population or GDP). Use the "view size" slider to zoom in and out on the data, and the "view range" slider to move the position of the current view across the graph. The "currency" choices are provided for use when GDP is graphed. "USDollars" and "Adjusted" both represent currency in U.S. Dollars, but "Adjusted" converts to current U.S. dollars. The same pattern holds for "Local" and "LocalAdjusted".
Contributed by: Alan Joyce (September 2007)
Open content licensed under CC BY-NC-SA
Snapshots


Details
detailSectionParagraphPermanent Citation
"Country Statistics over Time"
http://demonstrations.wolfram.com/CountryStatisticsOverTime/
Wolfram Demonstrations Project
Published: September 28 2007
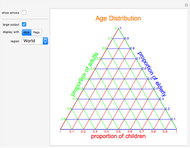 Age Distribution in the World
Christopher Pehl and Sergio Hannibal Mejia (Yokohama International School)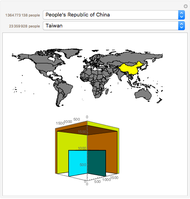 Population Cube
Michael Schreiber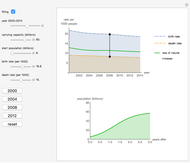 Projected Rates of World Population Increase
Chloe David and Nikki Menis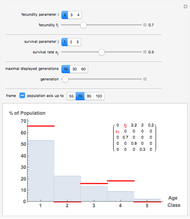 Age Distributions from a Leslie Model for Age-Structured Populations
J. Ackermann and H. Hogreve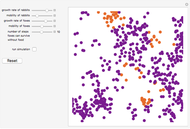 Predator-Prey Ecosystem: A Real-Time Agent-Based Simulation
Hiroki Sayama World Bank Data Series Overview
Michael Schreiber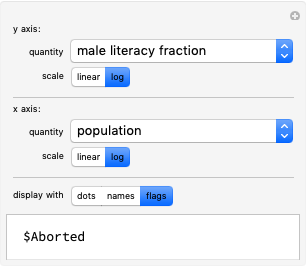 Comparing Data on Countries
Stephen Wolfram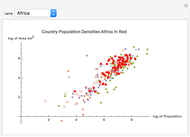 Human Population Densities by Continent
Trevor Cole Do the Rich Live Longer?
Quang-Dao Trinh Population Selector
Ed Pegg Jr