Digital Determination of Output Voltage Harmonics in a Single-Phase Voltage Controller

Requires a Wolfram Notebook System
Interact on desktop, mobile and cloud with the free Wolfram Player or other Wolfram Language products.
In this Demonstration, the output voltage of a single-phase AC-AC voltage controller is measured at a sampling frequency of  times the fundamental frequency (
 is an integer exponent). The number of measurement samples taken within one cycle of the fundamental frequency gives a vector of
  measured values, which is then used to calculate the discrete Fourier transform (DFT) of the voltage waveform.
Contributed by: GISENER (December 2011)
Team: Diego M. Ferreyra, Hernán Asís, Fabián Dopazo, Paulo Gianoglio
Open content licensed under CC BY-NC-SA
Snapshots
Details
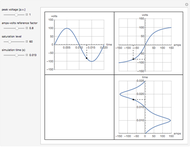
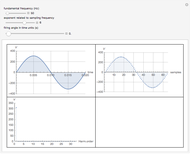
The graph at the top left shows a time plot of the actual voltage waveform, resulting from the adjustment of the controller semiconductor firing angle. The semiconductor assembly, connected in series between the supply and the load, may comprise a pair of SCRs connected back-to-back, a TRIAC, or other arrangements including diodes and SCRs. While it is true that firing angles are usually measured from  backward, in this Demonstration they have been deliberately related to the beginning of the semicycle and measured from
  forward. The RMS mains supply voltage is set at 220 V, which corresponds to a peak value of approximately 311 V.
In the top-right graph, all the measured voltage values are plotted, including null values; the time-discretized version of the measured voltage is thereby given. However, no discretization has been applied to the voltage values, as would invariably be done in digital measurements.
Finally, the bottom-left graph shows the frequency spectrum obtained for the measured voltage waveform.
For the implementation of real-life digital measurements, the DFT algorithm would actually require the measured voltage to be filtered prior to measurement so as to leave out harmonic components of frequencies above the Nyquist frequency. Given the didactic purpose of this Demonstration, this filtering stage is not done. This certainly results in deviations in the harmonic spectrum values, but this does not impair the qualitative results.
References
[1] A. K. Chattopadhyay, "AC–AC Converters," in Power Electronics Handbook (M. H. Rashid, ed.), San Diego: Academic Press, 2001.
[2] M. T. Heath, Scientific Computing: An Introductory Survey, 2nd ed., New York: McGraw-Hill, 2002.
Permanent Citation


