Income and Substitution Effects


Requires a Wolfram Notebook System
Interact on desktop, mobile and cloud with the free Wolfram Player or other Wolfram Language products.
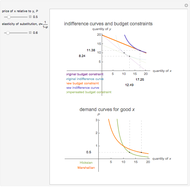
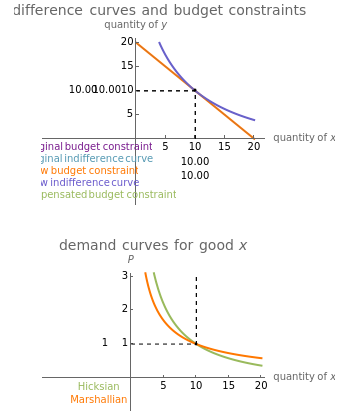
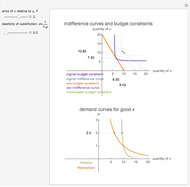
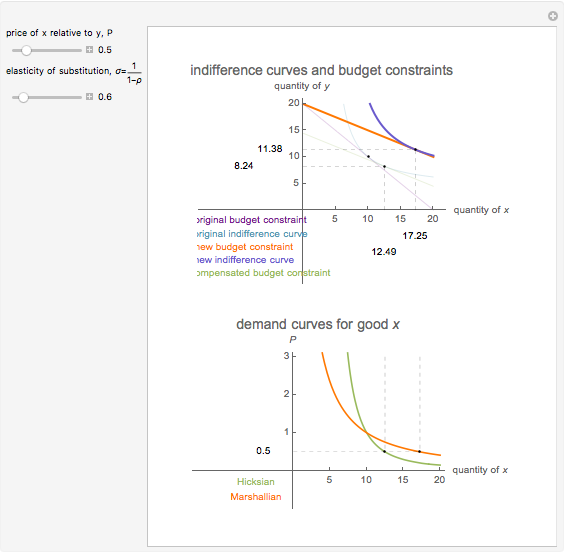
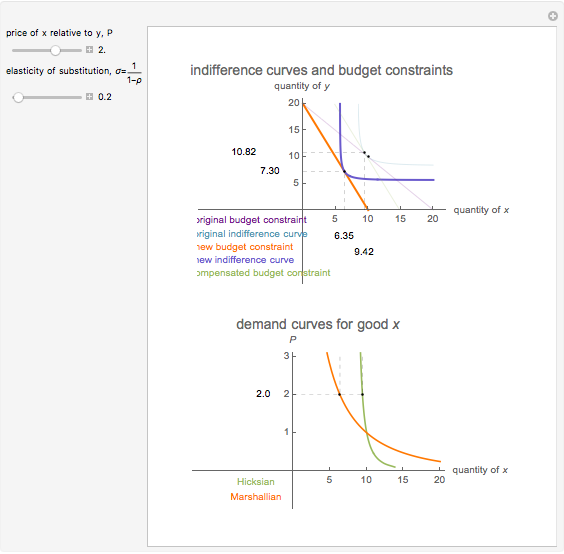
The effect of a change in a relative price has two effects on the optimal consumption bundle. The substitution effect is the change in consumption that would prevail if the consumer was compensated in such a way that they maintained their original utility level. The income effect is the change in consumption that results from the gain or loss of purchasing power. The Hicksian or "compensated" demand curve is associated with the substitution effect alone, while the Marshallian demand curve is associated with the combination of the income and substitution effects. This analysis of a relative price change is referred to as the "Slutsky decomposition".
[more]


Contributed by: William J. Polley (March 2011)
Open content licensed under CC BY-NC-SA
Snapshots


Details
This Demonstration illustrates the decomposition of a price change into the income and substitution effects. The utility function has a constant elasticity of substitution, which is represented by the slider for  . The Cobb-Douglas case is the limiting case as
  tends to zero. In the Cobb-Douglas case (Snapshot 3), you can see that the income and substitution effects exactly balance each other. Decreasing
  makes the goods more complementary and reduces the substitution effect. You can observe the relationship between the Hicksian and Marshallian demand curves for different elasticities of substitution.
Permanent Citation
 Constant Elasticity of Substitution Production
Kevin Balch and Seth J. Chandler Cobb-Douglas Production Functions
Seth J. Chandler The Present Value of Future Gas Use
Seth J. Chandler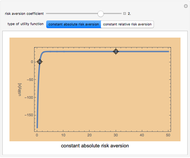 Constant Risk Aversion Utility Functions
Seth J. Chandler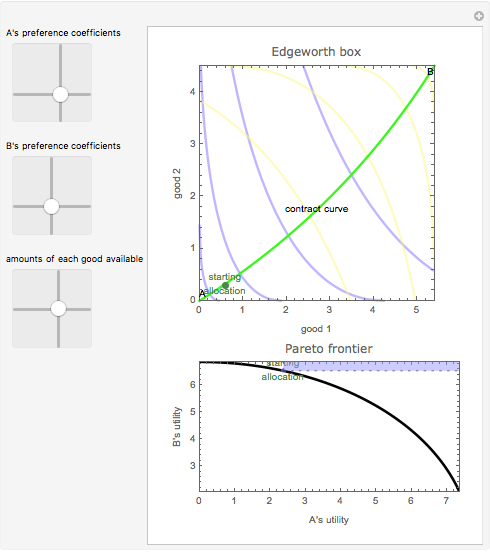 The Edgeworth Box
Seth J. Chandler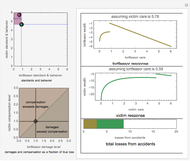 Bilateral Accident Model
Seth J. Chandler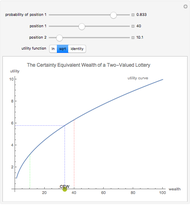 Certainty Equivalent Wealth
Seth J. Chandler Moral Hazard
Seth J. Chandler Investment Leverage Effect
Michael Schreiber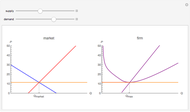 Profit Maximization in Perfect Competition
Fiona Maclachlan