The Power of a Test Concerning the Mean of a Normal Population

Requires a Wolfram Notebook System
Interact on desktop, mobile and cloud with the free Wolfram Player or other Wolfram Language products.
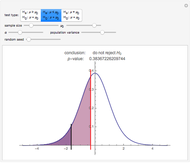
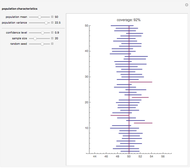
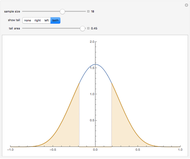
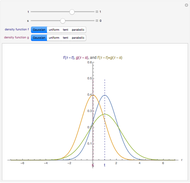
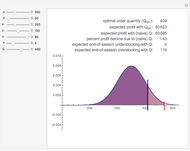
This Demonstration considers the three basic hypothesis tests about the mean of a normal population whose parameters are controlled by the first and third sliders. The area of the blue region is the significance level of the selected test, and the area of the purple region is the power of the selected test.
Contributed by: Chris Boucher (March 2011)
Open content licensed under CC BY-NC-SA
Snapshots
Details
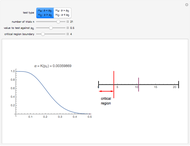
A statistical test of a left-, right-, or two-tailed research hypothesis versus the null hypothesis  is conducted based on where the mean of a randomly drawn sample from the population in question falls. If the sample mean falls into the critical region, the null hypothesis is rejected, and there is statistical support for the research hypothesis. The probability that the sample mean lands in the critical region when the null hypothesis is in fact true—the probability of a type I error—is called the significance level of the test and is the blue region above. The smaller this number, the more statistical support the test gives the research hypothesis. The probability that the sample mean lands in the critical region given that the true mean has some value μ is a function of μ and is called the power of the test. Roughly speaking, this number measures the likelihood that the test will correctly detect a discrepancy between the true mean μ and the comparison value
  .
.
Permanent Citation
"The Power of a Test Concerning the Mean of a Normal Population"
http://demonstrations.wolfram.com/ThePowerOfATestConcerningTheMeanOfANormalPopulation/
Wolfram Demonstrations Project
Published: March 7 2011


