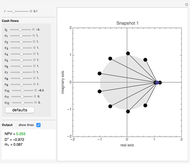
A Model Illustrating Multiple Interest Rate Analysis (MIRA)


Requires a Wolfram Notebook System
Interact on desktop, mobile and cloud with the free Wolfram Player or other Wolfram Language products.
Net present value (NPV) and internal rate of return (IRR) are criteria commonly employed by organizations to appraise investment projects. NPV is the present value of an investment's cash flows  ,
,  for
for  to
to  , discounted at the cost of capital
  , where is the investment’s initial outlay at time zero (negative), and is the investment’s net cash flow at time
  (revenues minus costs; usually positive but sometimes negative). IRR is the value of the discount rate setting NPV to zero.

Contributed by: Michael Osborne and Edward J O'Reilly (December 2015)
Open content licensed under CC BY-NC-SA
Snapshots


Details
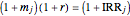
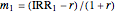
This Demonstration employs the dual NPV formula from [6]. The formula is  , in which
  is the markup of a selected IRR over the cost of capital. The selected IRR is usually the conventional one (assuming a real, positive IRR exists), though any one of the IRRs will do. The unfamiliar entity is
  , which is the product of the nonselected (usually unconventional) markups
  , for
, for  to , and
  .
.
MIRA demonstrates that the entity is equal to the duration of the adjusted set of cash flows ,  for to , duration being defined as their present-value, weighted-average term to maturity. This adjusted set
  is explained as follows. First, note that scaled cash flows
  determine the roots of the IRR equation,
  for
for  to , and that this process reverses—the TVM polynomial's factors (each factor containing a root) expand to recover the TVM polynomial’s coefficients (cash flows). Second, note the earlier observation that the dual formula for NPV per dollar outlay,
  , divides into two parts: the familiar part and the unfamiliar part . This division is such that the expression for is comprised of
  unconventional roots, , for to , and the
  root
root  containing the cost of capital. The factors containing these roots expand into a set of scaled cash flows
  slightly different from the original set. The two sets of cash flows and
  are highly correlated, possessing a similar structure, because they have roots in common and their roots differ only slightly:
  compared with
  . As a result, the duration of the set is close in value to the duration of the original set , but it is not the same: it is subtly different, and it is the duration of this adjusted set that enters the dual formula for NPV.
The model demonstrates that varying a cash flow or varying the cost of capital results in complex shifts in the roots and markups. Despite this complexity, the dual NPV formula exhibits a simple, invariant relationship between its three components: NPV per dollar outlay, the selected markup, and cash flow duration (as defined above).
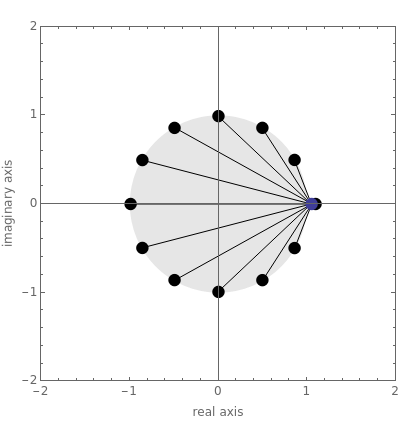
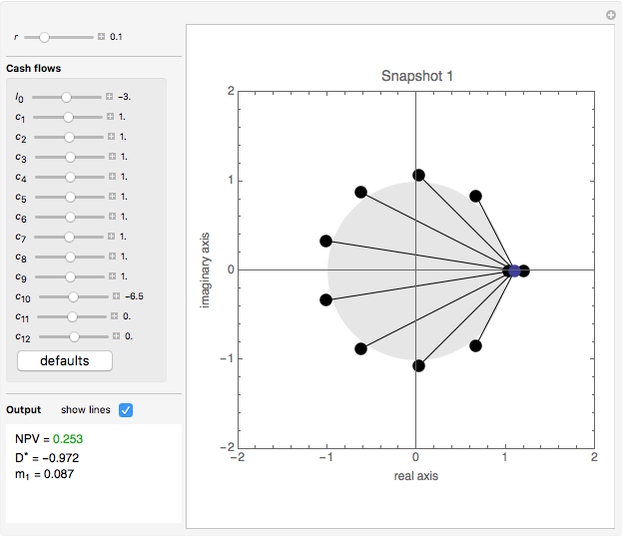
Snapshot 1 illustrates the classic "oil-pump project" in which an outflow of cash today is followed by a stream of positive net cash flows ending with a negative cash flow in year ten, perhaps to cover cleanup costs [1]. Two changes of sign in the sequence of cash flows results in two feasible IRRs of 3.5% and 19.54%. Conventional theory says that this situation is ambiguous because one IRR is higher than the assumed cost of capital and the other is lower. In contrast, MIRA sees no ambiguity, because the dual NPV formula incorporates all markups at once, including the two markups containing the feasible IRRs. Whichever markup of IRR over the cost of capital is selected as the IRR investment criterion, its companion markups combine with it, incorporating valuable information (about the structure of the project’s "selected-markup-adjusted-cash-flows") into the value of NPV per dollar outlay.
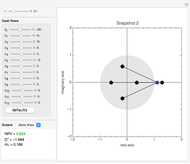
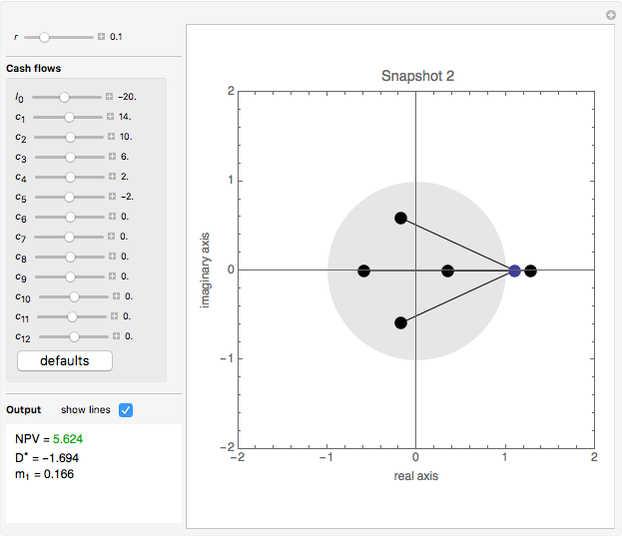
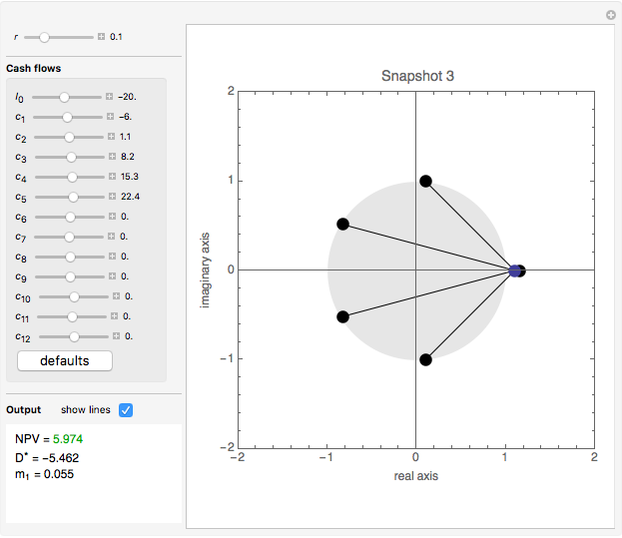
Snapshots 2 and 3 illustrate two projects whose NPVs and IRRs give conflicting rankings [7]. The NPV per dollar outlay for project  (5.9741 / 20=0.2987) exceeds the NPV per dollar outlay for project
  (5.6238 / 20=0.2812), despite the fact that the conventional markup of IRR over the cost of capital for [(0.1602–0.1) / 1.1=0.0547] is considerably less than that for [(0.2826–0.1) / 1.1=0.1660]. These inconsistent decisions are wholly explained by the duration of the adjusted cash flows for project exceeding that for (5.4620 compared with 1.6940, respectively).
It has long been known that cash flow structure is a factor in "anomalous or ambiguous" IRR-based decisions; for example, [2] describes offending cash flows as having "unusual time shapes and reversals." To date, however, the literature has lacked a fully satisfactory explanation. The explanation in this Demonstration is concise and subtle: concise because the unconventional interest rates collapse into a single, real-valued financial statistic: duration, capturing pattern in the adjusted cash flows; subtle because the route to the adjusted cash flows is not obvious, the route involving analysis in the complex plane.
References
[1] R. Brealey, S. Myers, and F. Allen, Principles of Corporate Finance, 11th ed., New York: McGraw-Hill, 2013.
[2] J. Lorie and L. Savage, “Three Problems in Rationing Capital,” The Journal of Business, 28(4), 1955 pp. 229–239. www.jstor.org/stable/2351049.
[3] J. Graham and C. Harvey, “The Theory and Practice of Corporate Finance: Evidence from the Field,” Journal of Financial Economics, 60(2–3), 2001 pp. 187–243. doi:10.1016/S0304-405X(01)00044-7.
[4] L. Phalippou, “The Hazards of Using IRR to Measure Performance: The Case of Private Equity,” Journal of Performance Measurement, 12(4), 2008 pp. 55–67. papers.ssrn.com/sol3/papers.cfm?abstract_id=1111796.
[5] J. Cuthbert and M. Cuthbert, "Why IRR Is an Inadequate Indicator of Costs and Returns in Relation to PFI Schemes," Critical Perspectives on Accounting, 23(6), 2012 pp. 420–433. doi:10.1016/j.cpa.2012.05.001.
[6] M. J. Osborne, Multiple Interest Rate Analysis: Theory and Applications, Basingstoke, UK and New York: Palgrave Macmillan, 2014
[7] G. Hazen, “A New Perspective on Multiple Internal Rates of Return,” The Engineering Economist, 48(1), 2003 pp. 31–51. doi:10.1080/00137910308965050.
[8] F. Macaulay, Some Theoretical Problems Suggested by the Movement of Interest Rates, Bond Yields and Stock Prices in the United States since 1856, New York: National Bureau of Economic Research, 1938.
Permanent Citation
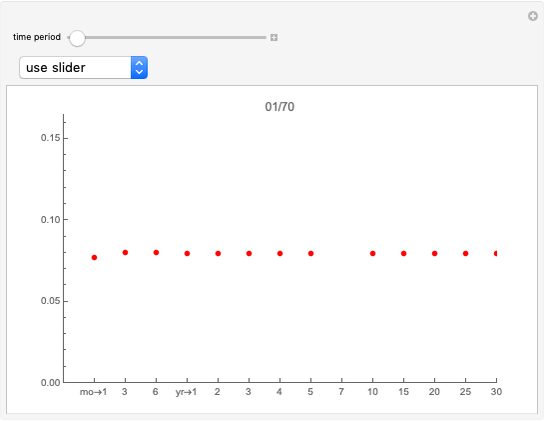 Term Structure of Interest Rates
Roger J. Brown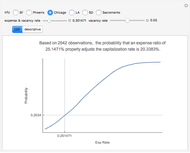 Capitalization Rate Probability
Roger J. Brown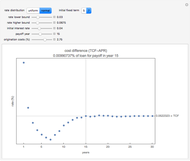 True Cost of Variable Rate Mortgage Funds
Roger J. Brown and Tom Compton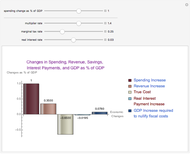 Krugman's Cost Benefit Analysis for Austerity Cuts in Government Spending
Michael Kelly (Finance Consultant) Bilateral Accident Model
Seth J. Chandler Unilateral Accident Model
Seth J. Chandler Logistic Sigmoid Market Model
Michael Schreiber Tax Rates and Tax Revenue
Seth J. Chandler Value Added Growth Model
Roger J. Brown Black-Scholes Option Model
Michael Kelly (Stuart GSB, Illinois Institute of Technology)