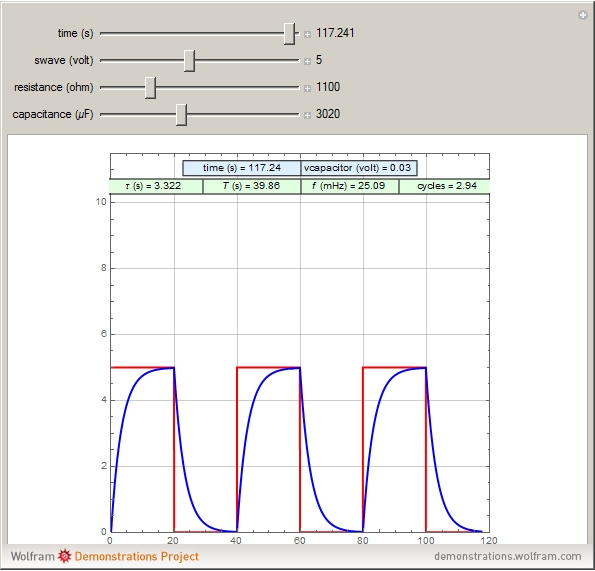
This Demonstration shows the voltage across a capacitor (blue curve) in an RC circuit with variable resistance and capacitance. The voltage source that powers the circuit is a positive square wave (red curve) with a period of

, where

, the time constant of the circuit. The times for the capacitor to be fully charged or fully discharged are both assumed to equal

. Use the "time" slider to control the progress of the simulation from 0 to 120 seconds, the "swave" slider to adjust the voltage (in volts) of the positive square wave, the "resistance" slider to change the value of the resistance

(in ohms) of the resistor and the "capacitance" slider to modify the capacitance

(in microfarads,

) of the capacitor. The colored grids in the top part of the plot area display the current values of time, voltage vcapacitor across the capacitor, time constant

of the circuit, period

and frequency

(in mHz) of the oscillations and the number of cycles that can be seen in the plot range.
![[Snapshot]](HTMLImages/index.en/thumbnail_1.gif)
![[Snapshot]](HTMLImages/index.en/thumbnail_2.gif)
![[Snapshot]](HTMLImages/index.en/thumbnail_3.gif)

 Browse all topics