Comparing the Regions of Polar and Cartesian Graphs


Requires a Wolfram Notebook System
Interact on desktop, mobile and cloud with the free Wolfram Player or other Wolfram Language products.
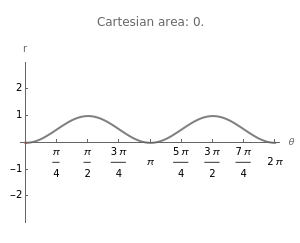
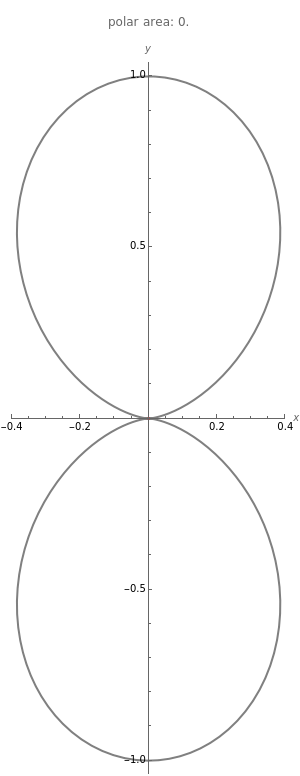
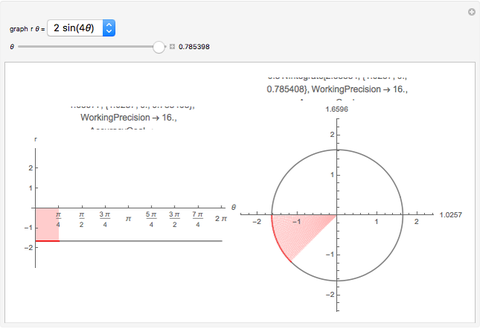
This Demonstration uses trigonometric curves to show the differences between regions of polar and Cartesian graphs. The left side of the Demonstration shows the Cartesian graph and its region, and the right side shows the polar graph and its region. You can choose among different trigonometric curves to see the differences between the polar and Cartesian graphs. The values of  are restricted to where the graph of the polar equation does not overlap itself. There is no simple correspondence between the areas of the two regions.
Contributed by: Farzaan Kaiyom (April 2018)
Open content licensed under CC BY-NC-SA
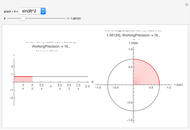
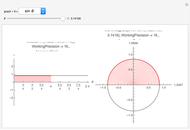
Snapshots


Details
This was a project for Advanced Topics in Mathematics II, 2017–2018, Torrey Pines High School, San Diego, CA.
Permanent Citation
"Comparing the Regions of Polar and Cartesian Graphs"
http://demonstrations.wolfram.com/ComparingTheRegionsOfPolarAndCartesianGraphs/
Wolfram Demonstrations Project
Published: April 6 2018
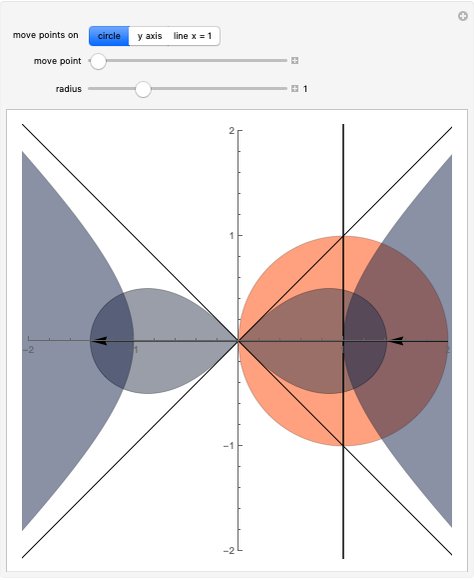 Hyperbolas, Lemniscates, and Cassini Ovals Generated by w = Sqrt(z)
Jaime Rangel-Mondragon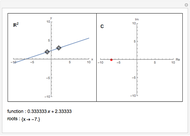 Polynomial Roots in the Complex Plane
Faisal Mohamed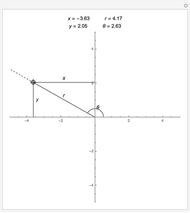 Polar Coordinates
Chris Boucher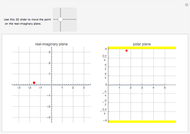 Complex Numbers in Rectangular and Polar Form
Ken Levasseur (UMass Lowell)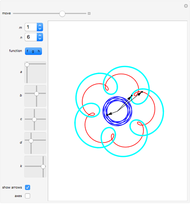 Linear Combinations of Curves in Complex Plane
Izidor Hafner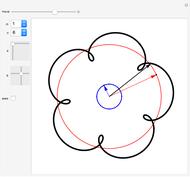 Functions in Two-Dimensional Vector Space or Complex Plane
Izidor Hafner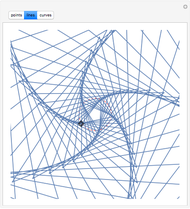 Complex Power Spirals
Germán Alvarado Jiménez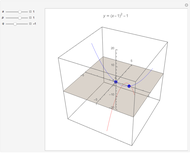 The Parabola's Evil Twin: Real and Nonreal Roots of a Real Quadratic
Phil Ramsden Spiral Explorer
Michael Croucher Complex Roots of a Polynomial and Its Derivative
Michael Schreiber
