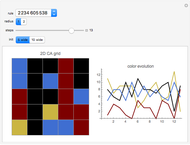
Horizontal Visibility Graphs for Elementary Cellular Automata

Requires a Wolfram Notebook System
Interact on desktop, mobile and cloud with the free Wolfram Player or other Wolfram Language products.
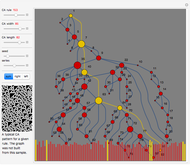
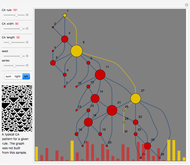
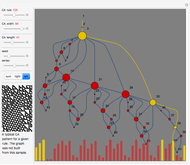
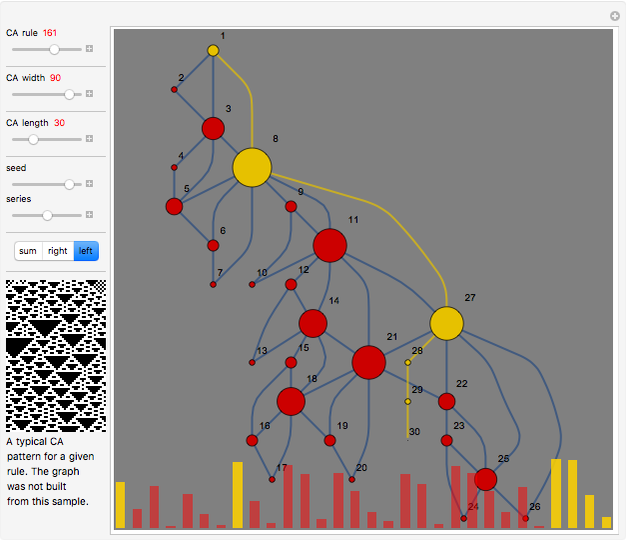
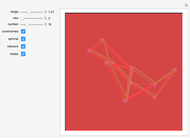
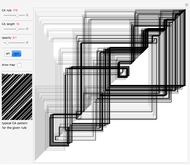
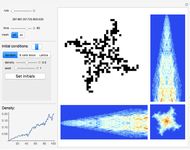
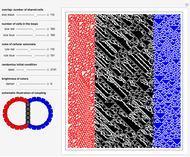
A time series can be formed from an evolution of a finite elementary cellular automaton (ECA). This can be done in a few different ways. We can consider every step of an ECA evolution to be a binary number and calculate its decimal form by counting digits from left to right or in reverse. We also could just sum the digits. These operations are reflected correspondingly in the control buttons "left," "right," and "sum."
[more]
Contributed by: Vitaliy Kaurov (February 2013)
Open content licensed under CC BY-NC-SA
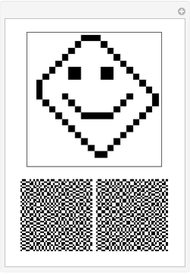
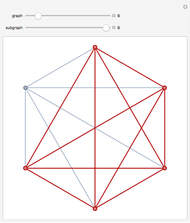
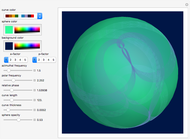
Snapshots


Details
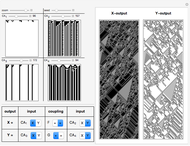
There are various mappings from time series to visibility graphs. HVG is one of the simplest algorithms. Some more elaborate schemes claim a partial inverse operation. The main idea behind these mappings is their ability to apply time series and signal processing tools to graphs and metrics of graphs to time series. This may lead to discoveries of new relationships and a better understanding of old ones.
References
[1] A. S. L. O. Campanharo, M. I. Sirer, R. D. Malmgren, F. M. Ramos, and L. A. N. Amara, "Duality between Time Series and Networks," PLoS One, 6(8), 2011 e23378. www.ncbi.nlm.nih.gov/pmc/articles/PMC3154932.
[2] L. Lacasa, B. Luque, F. Ballesteros, J. Luque, J. C. Nuño, "From Time Series to Complex Networks: The Visibility Graph," PNAS, 105(13), 2008 pp. 4972–4975. www.pnas.org/content/105/13/4972.full.
[3] B. Luque, L. Lacasa1, F. Ballesteros, and J. Luque, "Horizontal Visibility Graphs: Exact Results for Random Time Series," Physical Review E, 80(4), 046103, 2009. pre.aps.org/abstract/PRE/v80/i4/e046103.
[4] V. Fioriti, A. Tofani, and A. Di Pietro, "Discriminating Chaotic Time Series with Visibility Graph Eigenvalues," Complex Systems, 21(3), 2012 pp. 193–200. www.complex-systems.com/abstracts/v21_i03_a03.html.
Permanent Citation
"Horizontal Visibility Graphs for Elementary Cellular Automata"
http://demonstrations.wolfram.com/HorizontalVisibilityGraphsForElementaryCellularAutomata/
Wolfram Demonstrations Project
Published: February 5 2013
 Four-Color Outer Median Cellular Automata on the Grid
Abigail Nussey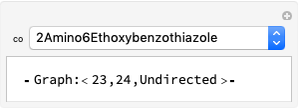 Molecular Graphs
Jaime Rangel-Mondragon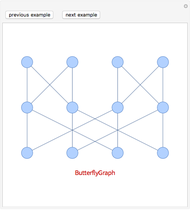 Parameterized Families of Graphs
Jaime Rangel-Mondragon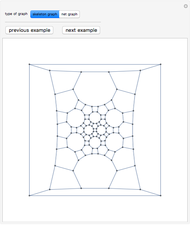 Curated Collections of Graphs
Jaime Rangel-Mondragon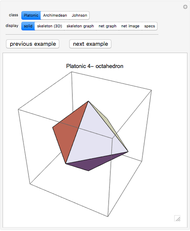 Polyhedra and Their Graphs
David William Carraher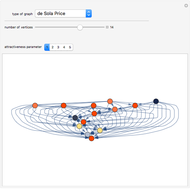 Random Graph Models
Jaime Rangel-Mondragon Automated Graph Layout
Jaime Rangel-Mondragon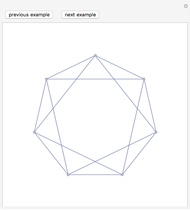 Is This Graph Planar?
Jaime Rangel-Mondragon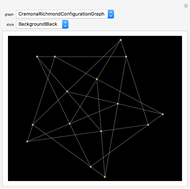 Collection of Graph Styles
Jaime Rangel-Mondragon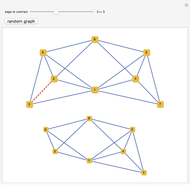 Edge Contraction in a Graph
Jaime Rangel-Mondragon
-
 Constrained Optimal Routes in 3D Space
Vitaliy Kaurov -
 Iconography for Elementary Cellular Automata Based on Radial Convergence Diagrams
Vitaliy Kaurov -
 Order, Chaos, and the Formation of a Cantor Set Attractor in Elementary Cellular Automata
Vitaliy Kaurov -
 Cobweb Diagrams of Elementary Cellular Automata
Vitaliy Kaurov -
 Time Series and Cobwebs for Arbitrary Recursive Maps on the Unit Interval
Vitaliy Kaurov -
 Peter de Jong Attractors
Vitaliy Kaurov -
 Horizontal Visibility Graphs for Elementary Cellular Automata
Vitaliy Kaurov -
 Digital Representation of a Nonlinear ODE with Small Differences in Initial Conditions
Vitaliy Kaurov -
 Two-Dimensional Block Cellular Automata with a 2×2 Neighborhood
Vitaliy Kaurov -
 Single-Share Password-Protected Visual Cryptography via Cellular Automata
Vitaliy Kaurov -
 Random Subgraph of a Complete Graph
Vitaliy Kaurov -
 Lissajous Patterns on a Sphere Surface
Vitaliy Kaurov -
 Cellular Automata Coupled by Overlap or Common Boundary
Vitaliy Kaurov -
 Two-Dimensional Cellular Automata from One-Dimensional Rules
Vitaliy Kaurov -
 Coupled Cellular Automata: Symbiotic Patterns and Synchronization
Vitaliy Kaurov -
 Simulating Flickering Fire with Noisy Cellular Automaton
Vitaliy Kaurov