Polar Graph of a Variable Trig Ratio
Initializing live version


Requires a Wolfram Notebook System
Interact on desktop, mobile and cloud with the free Wolfram Player or other Wolfram Language products.
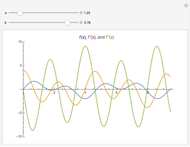
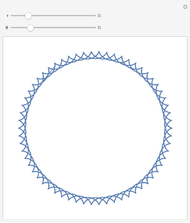
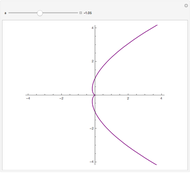
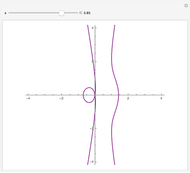
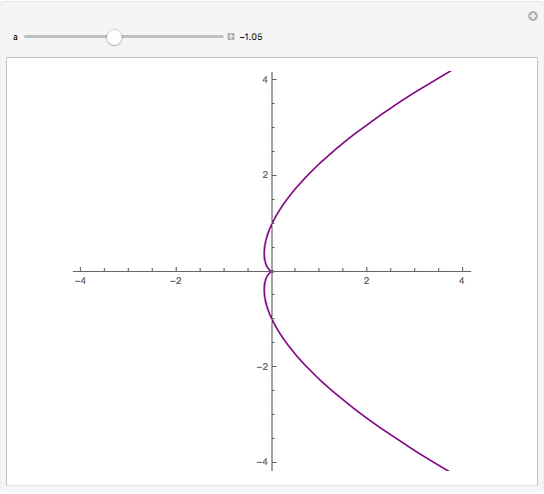
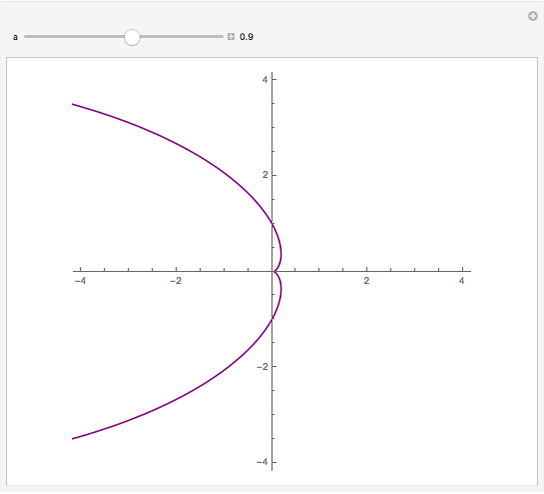
This Demonstration investigates how the polar graph of  changes as
  varies from -10 to 10.
Contributed by: Denis Shubleka (March 2011)
Open content licensed under CC BY-NC-SA
Snapshots


Details
detailSectionParagraphPermanent Citation
"Polar Graph of a Variable Trig Ratio"
http://demonstrations.wolfram.com/PolarGraphOfAVariableTrigRatio/
Wolfram Demonstrations Project
Published: March 7 2011
Related Demonstrations
More by Author
 Morphing Cartesian to Polar Coordinates
Abby Brown Polar Plots Drawn by a Mechanical Linkage
Erik Mahieu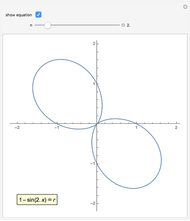 The Polar Equations of Hearts and Flowers
Michael Croucher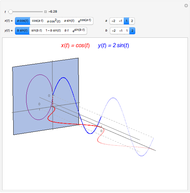 Parametric Plots from Rectangular Plots
Laura R Lynch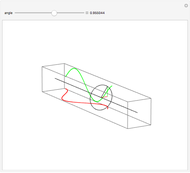 Sine and Cosine in 3D
Brian Burns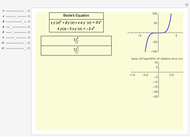 Boole Differential Equation with Continued Fractions
Andreas Lauschke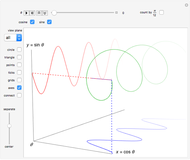 Sine and Cosine Helix
Abby Brown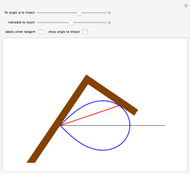 Trisecting an Angle Using a Lemniscate
Izidor Hafner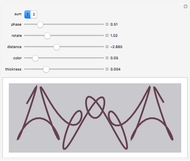 Designs for Ribbons and Friezes Based on Trigonometric Functions
Herbert W. Franke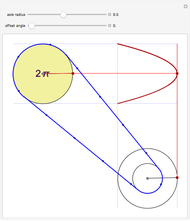 Generating Lissajous Figures
Michael Rogers (Oxford College/Emory University)