Weibull Fit to Computer Generated Fracture Data


Requires a Wolfram Notebook System
Interact on desktop, mobile and cloud with the free Wolfram Player or other Wolfram Language products.
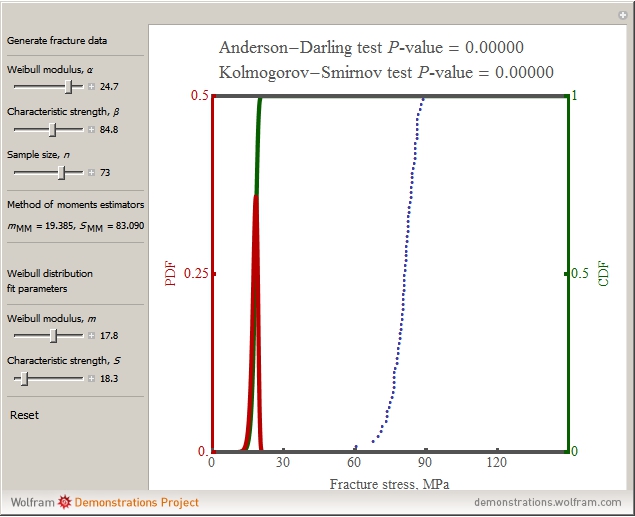
In this Demonstration, a sample size of  fracture values can be generated from a two-parameter (2P) Weibull distribution function with parameters
  and
and  . Subsequently, another 2P Weibull distribution with parameters
  and
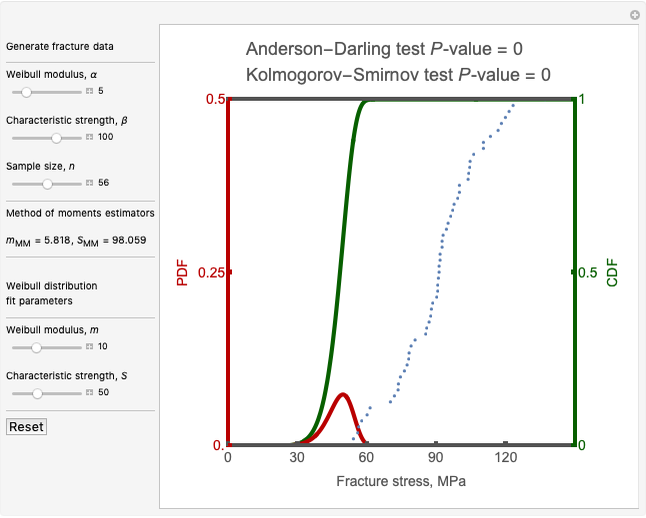
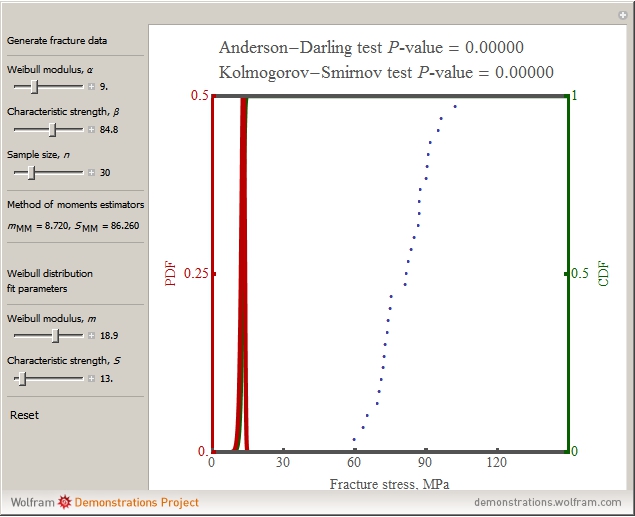
and  can be used to fit the generated fracture data. The Kolmogorov–Smirnov and Anderson–Darling goodness of fit test results are shown above the graph comparing the fracture data to the fitted distribution; a higher
  -value gives a better fit. The Anderson–Darling test gives more weight to the tails than the Kolmogorov–Smirnov test. The method of moments estimators
  and
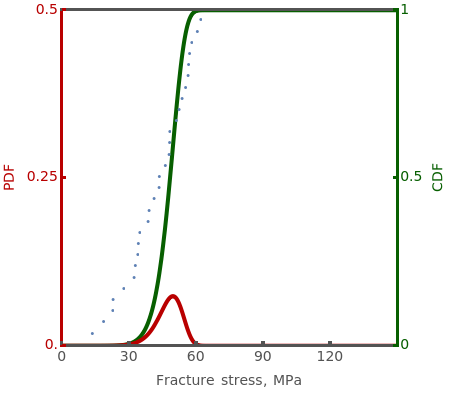
and  are calculated from the generated fracture data and can be used as inputs for Weibull distribution fit parameters. Blue points represent the fracture data, the green curve represents the cumulative distribution function (CDF) and the red curve represents the probability density function (PDF) of the fitted Weibull distribution function with parameters and .
Contributed by: Ozgur Keles (November 2012)
Open content licensed under CC BY-NC-SA
Snapshots
Details
Reference
[1] BS EN 843-1, Advanced Technical Ceramics, Monolithic Ceramics, Mechanical Tests at Room Temperature. Part I: Determination of Flexural Strength, 1995.
Permanent Citation
 Weibull Statistics for Fracture Data
Megan Frary (Boise State University)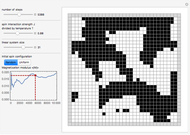 The 2D Ising Model Monte Carlo Simulation Using the Metropolis Algorithm
Darya Aleinikava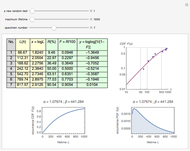 Fitting Lifetime Data to a Weibull Model
Frederick Wu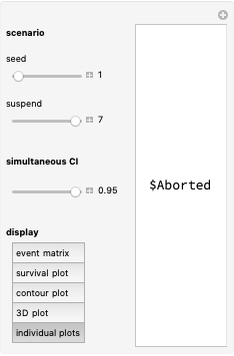 Simultaneous Confidence Interval for the Weibull Parameters
Michail Bozoudis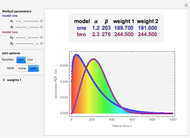 Comparing and Weighting Two Weibull Models
Frederick Wu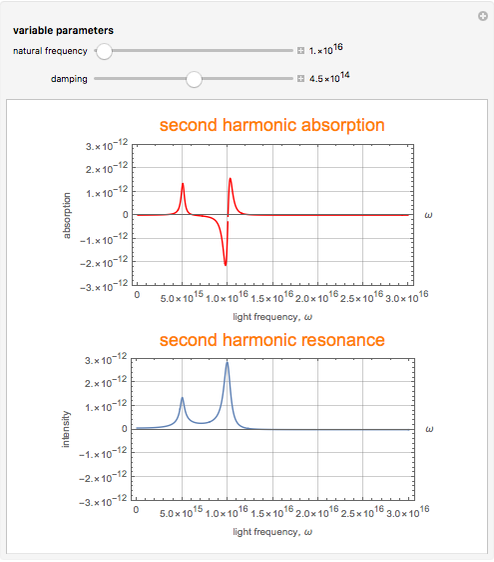 Second Harmonic Generation and Absorption Spectra
Hendradi Hardhienata Scanning Electrochemical Microscopy in Substrate Generator/Tip Collector Mode
Quang-Dao Trinh The Physics of Knives
Elizabeth Ellor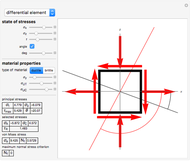 Mohr's Circle and Failure Criterion for Planar Stress States
Felipe R. Amador V. Erosion Index for Particulates
Mark D. Normand and Micha Peleg