Amplitude and Phase in 2D Fourier Transforms
Initializing live version

Requires a Wolfram Notebook System
Interact on desktop, mobile and cloud with the free Wolfram Player or other Wolfram Language products.
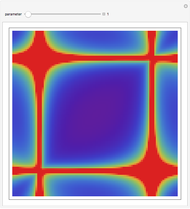
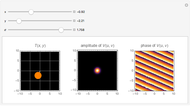
In this Demonstration, we take the 2D Fourier transform of a 2D Gaussian,  , with standard deviation
  :
:
Contributed by: Katherine Rosenfeld (April 2011)
Based on a talk by: David Wilner
Open content licensed under CC BY-NC-SA
Snapshots
Details
See slides 9 and 10 from David Wilner's talk "Imaging and Deconvolution" available at http://www.aoc.nrao.edu/events/synthesis/2010/lectures10.html.
Permanent Citation


