Confidence and Prediction Bands


Requires a Wolfram Notebook System
Interact on desktop, mobile and cloud with the free Wolfram Player or other Wolfram Language products.
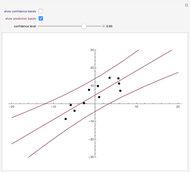
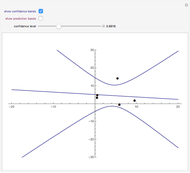
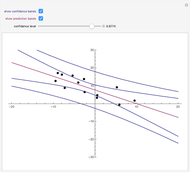
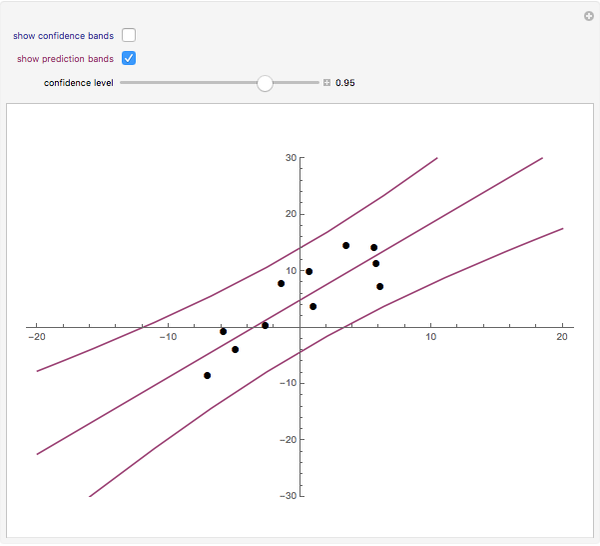
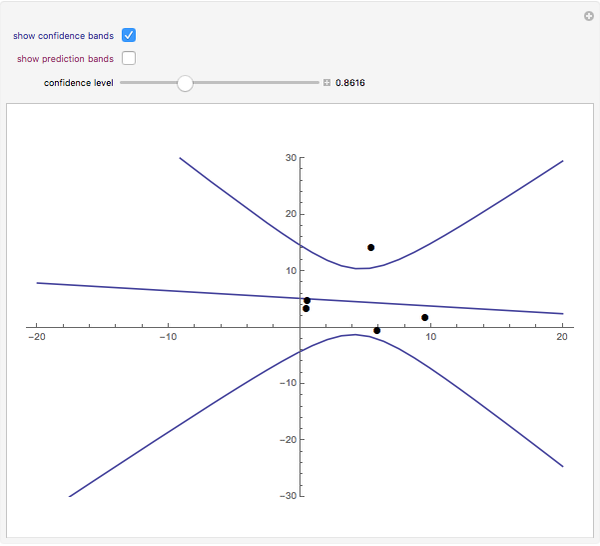
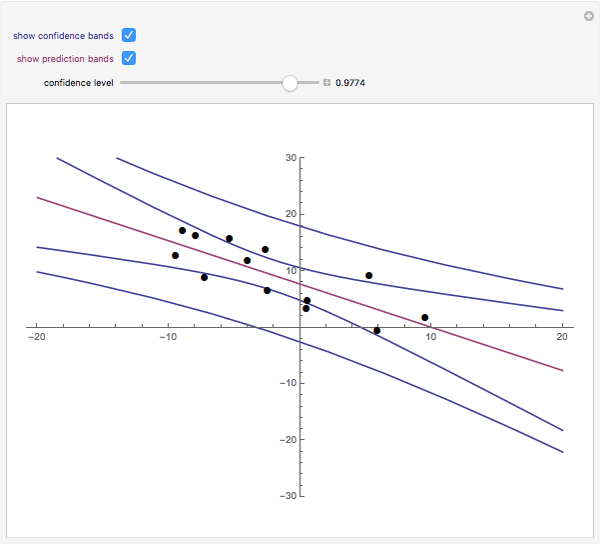
Drag the points or alt-click the plot to add or subtract points from the dataset. The least-squares regression line for the dataset is shown, as well as the option to include confidence or prediction bands with a confidence level that you can adjust with the slider.
Contributed by: Chris Boucher (March 2011)
Open content licensed under CC BY-NC-SA
Snapshots
Details
The least-squares regression line is the line that best fits a bivariate dataset in the sense of minimizing the sum of the squares of the vertical distances from each point in the dataset to the line. Denote the points in the dataset ( . Assume that
  follows a normal distribution whose mean is a linear function of
  (with unknown slope and intercept) and whose standard deviation is a constant function of . Then a confidence interval for the expected value of can be constructed using standard techniques. As the expected value of is a function of , the endpoints of this interval will be as well. When plotted as a function of , these endpoints form "confidence bands" between which runs the regression line.
A confidence interval for the value associated with a new value (as opposed to a confidence interval for the mean of all such values) is called a prediction interval. Its endpoints are also functions of , which when plotted form "prediction bands". As individual values vary more than their mean, the prediction bands are wider than the confidence bands.
Permanent Citation
 Confidence Intervals for a Mean
Chris Boucher Distributions of Order Statistics
Chris Boucher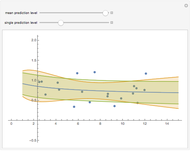 Mean and Single Prediction Bands for a Nonlinear Model
Darren Glosemeyer Nonparametric Regression and Kernel Smoothing: Confidence Regions for the L2-Optimal Curve Estimate
Didier A. Girard Predictive Scores and Ultimate Test Passage
Seth J. Chandler The r-Distribution
Chris Boucher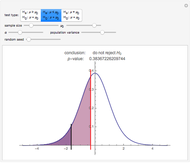 Hypothesis Tests about a Population Mean
Chris Boucher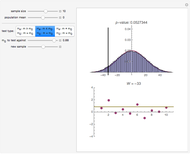 A Signed Rank Test of Hypotheses about a Median
Chris Boucher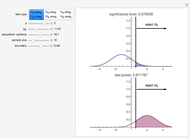 The Power of a Test Concerning the Mean of a Normal Population
Chris Boucher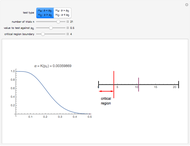 Power of a Test about a Binomial Parameter
Chris Boucher
-
Hypothesis Tests about a Population Mean
Chris Boucher -
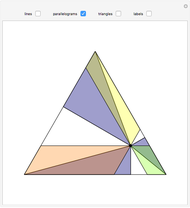 Fair Sharing of an Equilateral Triangular Pizza
Chris Boucher -
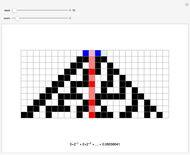 Using Rule 30 to Generate Pseudorandom Real Numbers
Chris Boucher -
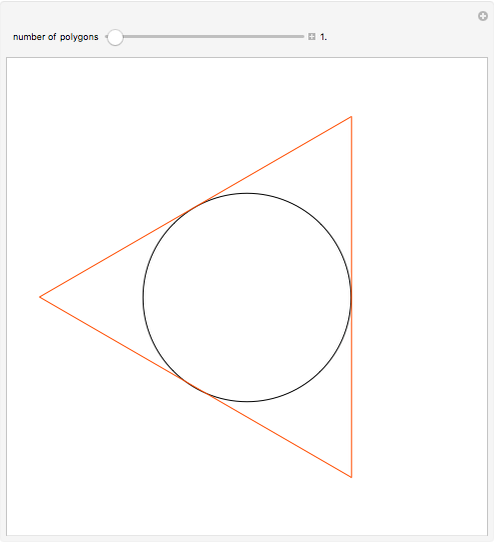 Circumscribing Polygons
Chris Boucher -
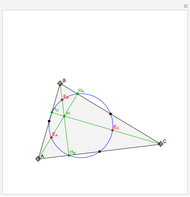 Nine-Point Circle
Chris Boucher -
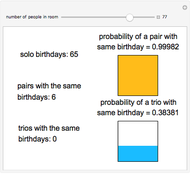 The Birthday Problem
Chris Boucher -
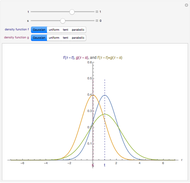 Convolutions of Shifted Densities
Chris Boucher -
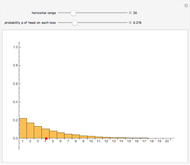 Geometric Distribution
Chris Boucher -
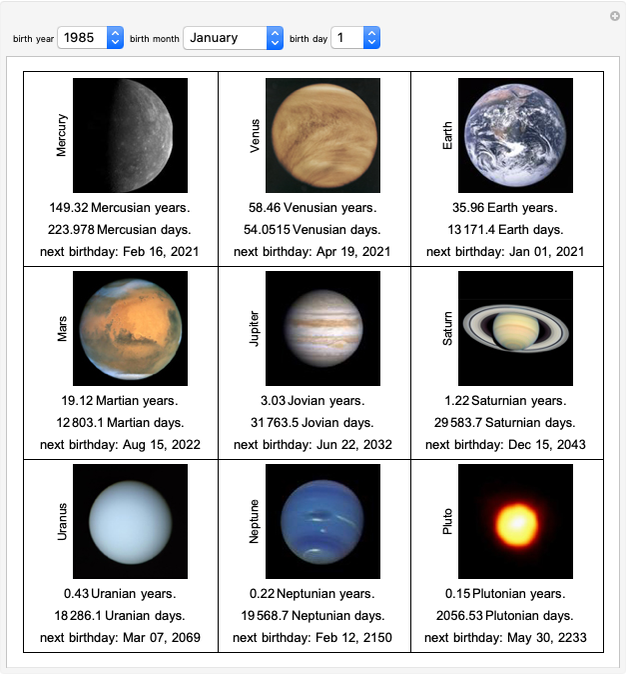 How Old Would You Be on Another Planet (or Pluto)?
Chris Boucher -
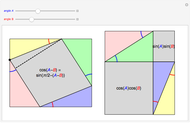 Difference Formula for Cosine
Chris Boucher -
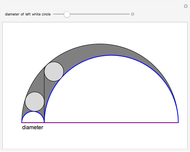 The Arbelos
Chris Boucher -
Confidence Intervals for a Mean
Chris Boucher -
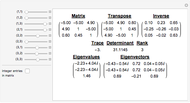 3x3 Matrix Explorer
Chris Boucher -
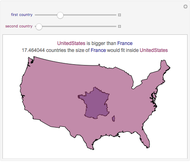 Which Country Is Bigger?
Chris Boucher -
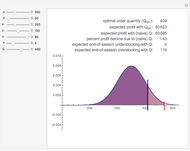 Capacity Planning for Short Life Cycle Products: The Newsvendor Model
Chris Boucher -
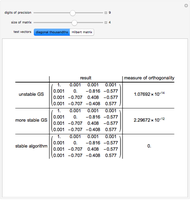 Numerical Instability in the Gram-Schmidt Algorithm
Chris Boucher -
 Poisson Distribution
Chris Boucher -
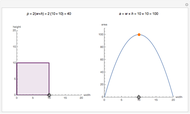 Maximizing the Area of a Rectangle with Fixed Perimeter
Chris Boucher -
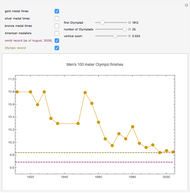 Olympic Medal Times in the Men's 100 Meter
Chris Boucher -
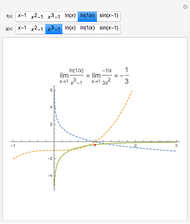 L'Hospital's Rule for 0/0 Forms
Chris Boucher