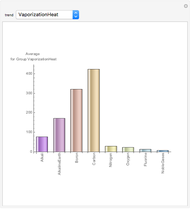
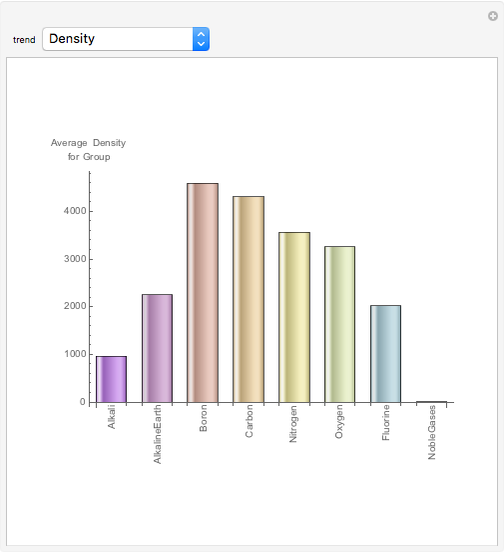
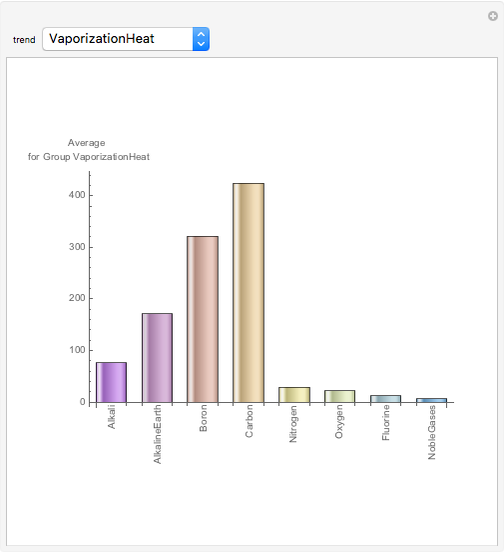
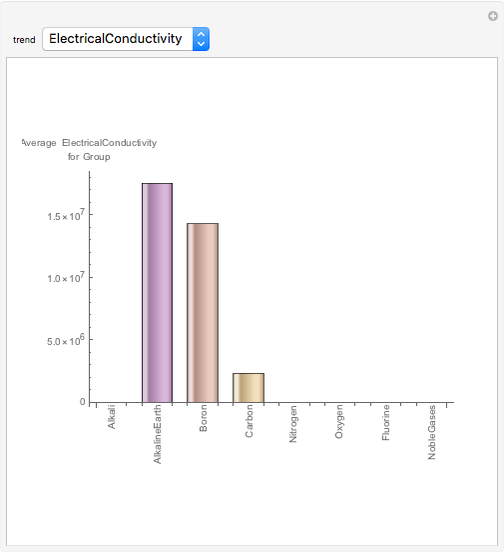
Group Trends for Elements in the Periodic Table


Requires a Wolfram Notebook System
Interact on desktop, mobile and cloud with the free Wolfram Player or other Wolfram Language products.
To use this Demonstration, select a property that you would like to explore from the drop-down menu. The graph will display a scale on the vertical axis. Mouseover the bar to see the specific value, the average over the entire vertical group in the periodic table. If a property does not apply, no value is shown.
Contributed by: Ashu Goel and Jason Miller (January 2011)
Open content licensed under CC BY-NC-SA
Snapshots


Details
detailSectionParagraphPermanent Citation
"Group Trends for Elements in the Periodic Table"
http://demonstrations.wolfram.com/GroupTrendsForElementsInThePeriodicTable/
Wolfram Demonstrations Project
Published: January 20 2011
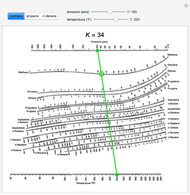 DePriester Chart for Hydrocarbons
Majed N. Aldossary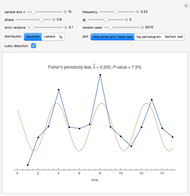 Detecting Periodicity in Short Time Series
Ian McLeod and Yuanhao Lai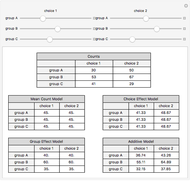 Comparing Models for Two-Way Contingency Tables
Darren Glosemeyer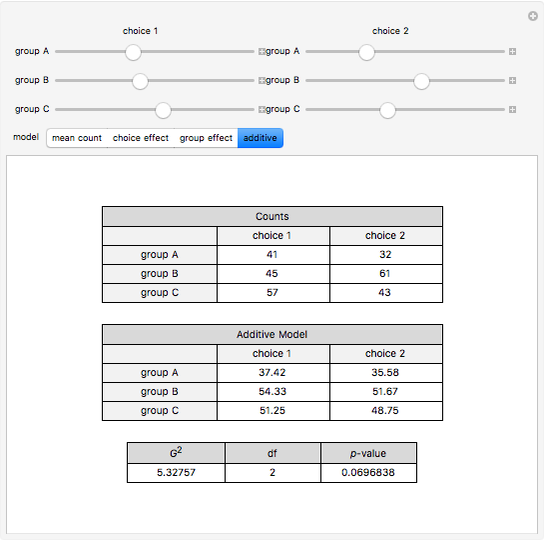 Likelihood-Based Goodness of Fit in Two-Way Contingency Tables
Darren Glosemeyer Build the Periodic Table
Enrique Zeleny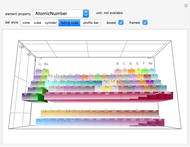 Periodic Table in 3D
Yu-Sung Chang and Brett Champion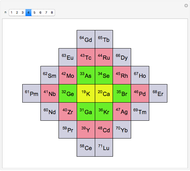 An Alternative Periodic Table
Enrique Zeleny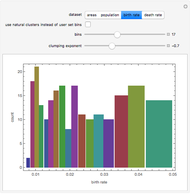 Grouping Country Data
Seth J. Chandler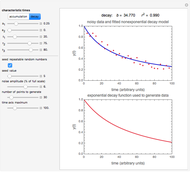 Characteristic Times in Accumulation and Decay
Mark D. Normand and Micha Peleg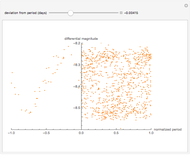 Cepheid Variable Star Light Curve Analysis
Jeff Bryant
