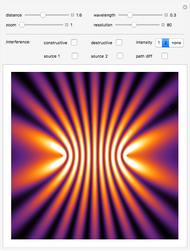
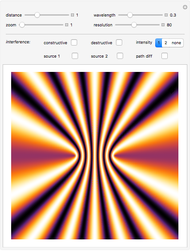
Intensity Distribution from Two Coherent Sources
Initializing live version

Requires a Wolfram Notebook System
Interact on desktop, mobile and cloud with the free Wolfram Player or other Wolfram Language products.
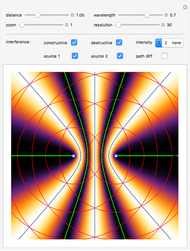
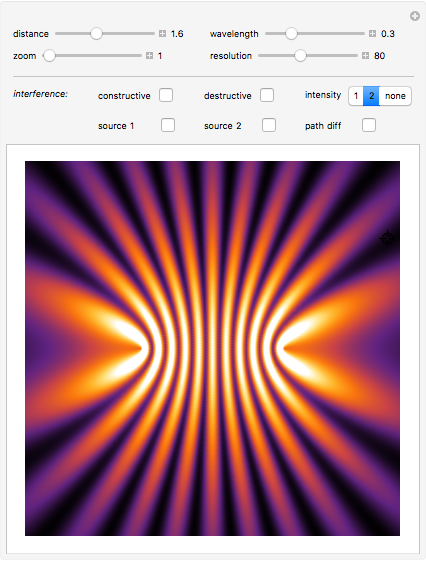
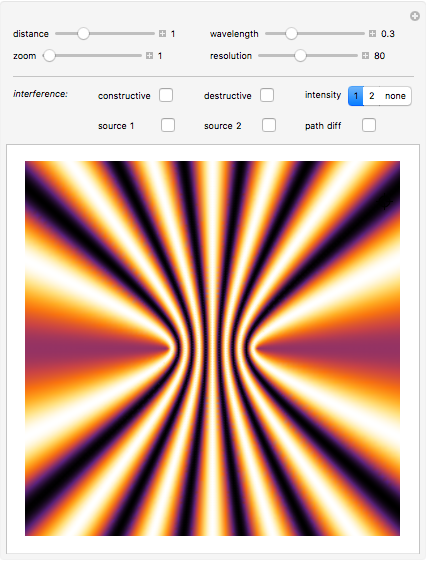
This Demonstration shows the two-dimensional intensity distribution generated by the interference of two coherent wave sources. The distance between the two sources, as well as their wavelength, can be varied. Lines of constructive and destructive interference can be displayed, hyperbolic in shape. The locator on the diffraction pattern can be moved to show the path difference as an integer or half-integer multiple of the wavelength.
[more]
Contributed by: Lorenzo Roi (June 2019)
Open content licensed under CC BY-NC-SA
Details
Snapshots


Permanent Citation
Related Demonstrations
More by Author
 Polarization of an Electromagnetic Wave
Luis Jonathan Cervantes Rosas Electromagnetic Wave
Enrique Zeleny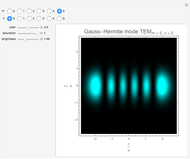 Gaussian Laser Modes
Antoine Weis Propagation of a Plane Electromagnetic Wave
Alan Fafard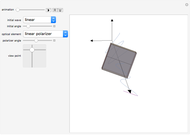 Polarization of an Optical Wave through Polarizers and Wave Plates
Fred E. Moolekamp and Kevin L. Stokes (University of New Orleans)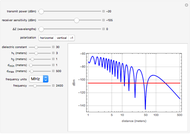 Radio Propagation and Multipath with Diversity Antennas
Allen Hollister Optical Rotation and Ellipticity
Jochen Autschbach Magnetizing Current Waveform in an Ideal Saturable Inductor
GISENER Spin-Weighted Spherical Harmonics
Satya Mohapatra Circular and Elliptic Polarization of Light Waves
Jochen Autschbach