Least-Squares Estimation of an Ellipse
Initializing live version


Requires a Wolfram Notebook System
Interact on desktop, mobile and cloud with the free Wolfram Player or other Wolfram Language products.
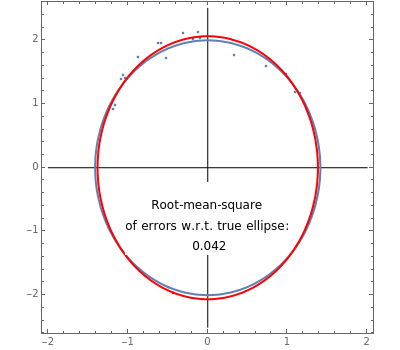
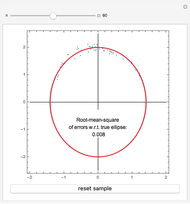
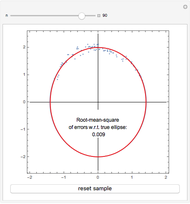
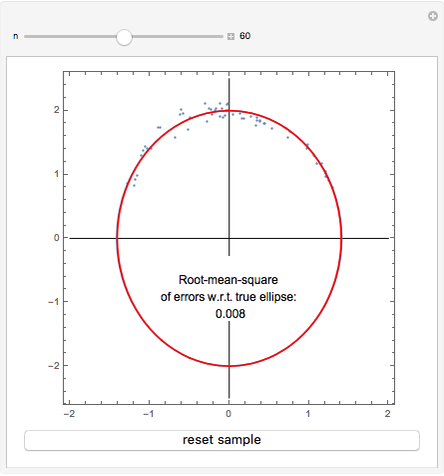
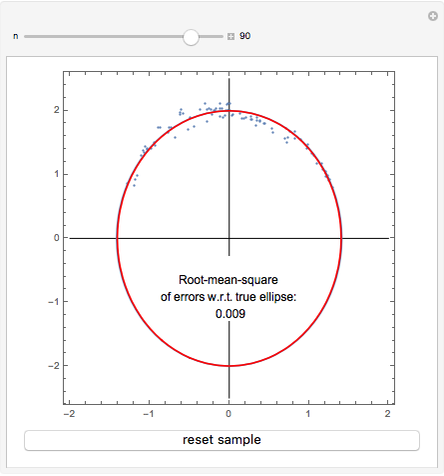
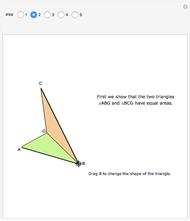
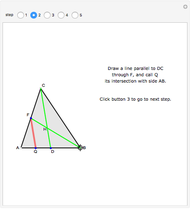
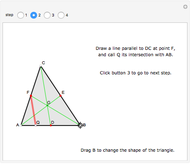
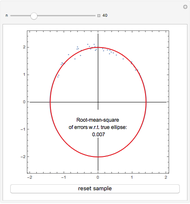
Given the ellipse  , a random sample of uniformly distributed abscissae in the interval
  is generated. From these a set of ordinates is obtained by adding to each corresponding point on the ellipse a normally distributed error with mean 0 and standard deviation 0.1. The set of points thus obtained is used to estimate the parameters of the ellipse with the least-squares method.

Contributed by: Tomas Garza (March 2011)
Open content licensed under CC BY-NC-SA
Snapshots


Details
Permanent Citation
Related Demonstrations
More by Author
 Monte Carlo Methods to Estimate Area
Tomas Garza Linear State Estimation Using a Weighted Least-Squares Method
Diego M. Ferreyra Least Squares Estimate Using a Monte Carlo Method
Richard Simson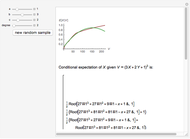 Estimating Conditional Expectations with Monte Carlo Simulation and Least Squares Regression
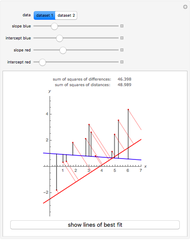
Andrzej Kozlowski Least Squares Criteria for the Least Squares Regression Line
Mariel Maughan and Bruce Torrence Comparing Least-Squares Fit and Least Absolute Deviations Fit
Frank Brechtefeld Density Estimation
Stephen Wolfram Maximum Likelihood Estimation
Marc Brodie (Wheeling Jesuit University) Kernel Density Estimation
Jeff Hamrick Sampling Statistics and Statistical Estimation
Olexandr Eugene Prokopchenko
-
 Stratification as a Device for Variance Reduction
Tomas Garza -
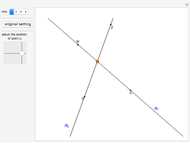 Intersection of Two Lines Using Vectors
Tomas Garza -
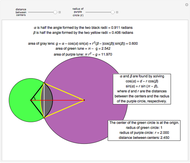 Areas of the Lens and Two Lunes of Two Intersecting Circles
Tomas Garza -
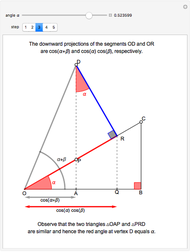 Cosine and Sine of the Sum of Two Angles
Tomas Garza -
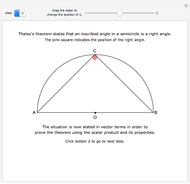 Thales's Theorem: A Vector-Based Proof
Tomas Garza -
 The Medians of a Triangle Divide It into Three Smaller Triangles of Equal Area
Tomas Garza -
 The Medians of a Triangle Are Concurrent: A Visual Proof
Tomas Garza -
 The Centroid of a Triangle Divides Each Median in the Ratio 1:2
Tomas Garza -
 Da Vinci's Proof of the Pythagorean Theorem
Tomas Garza -
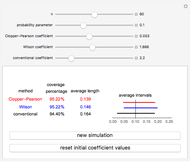 Confidence Intervals, Confidence Levels, and Average Interval Length
Tomas Garza -
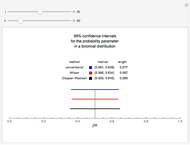 Confidence Intervals for the Binomial Distribution
Tomas Garza -
Monte Carlo Methods to Estimate Area
Tomas Garza -
 Least-Squares Estimation of an Ellipse
Tomas Garza -
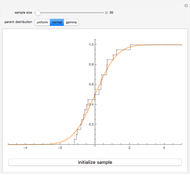 Convergence of the Empirical Distribution Function of a Sample
Tomas Garza -
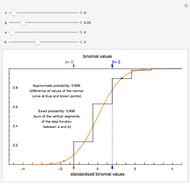 The de Moivre-Laplace Theorem in Probability Theory
Tomas Garza -
 The Law of the Iterated Logarithm in Probability Theory
Tomas Garza -
 Ordinary Regression and Orthogonal Regression in the Plane
Tomas Garza