Orbit Spectral Density in Olfactory Signal Processing

Requires a Wolfram Notebook System
Interact on desktop, mobile and cloud with the free Wolfram Player or other Wolfram Language products.
Spiking frequency of neurons in the mammalian olfactory epithelium is modulated by the concentrations of basic odorant molecules. A mix of several millimols of basic odorants, such as isoamyl acetate, limonene, or camphor, dispersed in Megaliters of air constitutes an olfactory stimulant perceived by the brain as a scent. The epithelium communicates the olfactory information by adjusting interspike intervals in neural signals. The overall interspike interval distribution encodes the information in myriads of neural spikings. A much‐compacted representation of the information is the orbit spectral density derived from the spiking distribution.
Contributed by: Andy G. Lozowski (March 2011)
Open content licensed under CC BY-NC-SA
Snapshots
Details
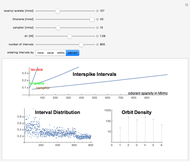
Orbit spectrum is computed using a collection of samples drawn from a distribution density function [1]. The samples are arranged to form a dynamical system whose periodic orbits serve as means to represent the shape of the underlying distribution. Scaling of the argument or the value of the distribution does not affect its orbit spectrum. In this Demonstration, six orbits of order five are used to illustrate the concept. All the samples are partitioned according to their distance from each of the orbits. The number of samples in each partition are the numeric values which constitute the orbit spectrum.
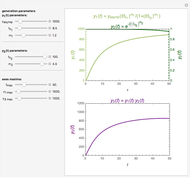
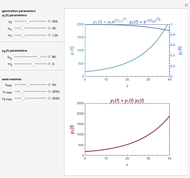
In this numerical example, orbit spectrum is used to quantify odorant mixes. Use the first three sliders to adjust the amount of each odorant in the mix. The relative positions of the three sliders determine the identity of the scent as would be perceived by a living organism [2]. The whole mix is dispersed in the air in the amount adjusted by slider four. This controls the scent intensity.
Interspike intervals, if recorded from the olfactory epithelium of a mammal, are the samples of the interval distribution. They can be ordered to inspect its cumulative function (order by value), mix composition (order by odorant), or orbit structure (show orbit partitions).
Orbit spectral density is dynamically calculated in response to every slider change. It is interesting to note that changing of the number of intervals (argument scaling) or changing the amount of air (value scaling) has less effect on orbit spectrum than changing the relative proportions of the odorants.
[1] A. G. Lozowski, "Orbit Spectral Density versus Stimulus Identity and Intensity," Chaos: An Interdisciplinary Journal of Nonlinear Science, 18(3), 2008 p. 033120.
[2] A. G. Lozowski, M. Lysetskiy, and J. M. Zurada, "Signal Processing with Temporal Sequences in Olfactory Systems", IEEE Transactions on Neural Networks, 15(5), 2004 pp. 1268–1275.
Permanent Citation
"Orbit Spectral Density in Olfactory Signal Processing"
http://demonstrations.wolfram.com/OrbitSpectralDensityInOlfactorySignalProcessing/
Wolfram Demonstrations Project
Published: March 7 2011


