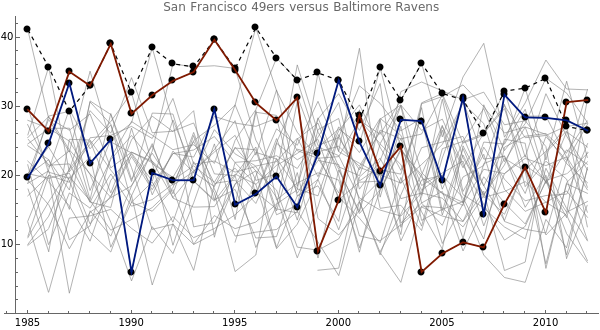
Ratings of NFL Teams from 1985 to 2012


Requires a Wolfram Notebook System
Interact on desktop, mobile and cloud with the free Wolfram Player or other Wolfram Language products.
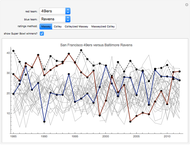
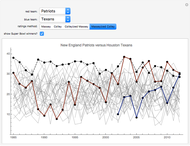
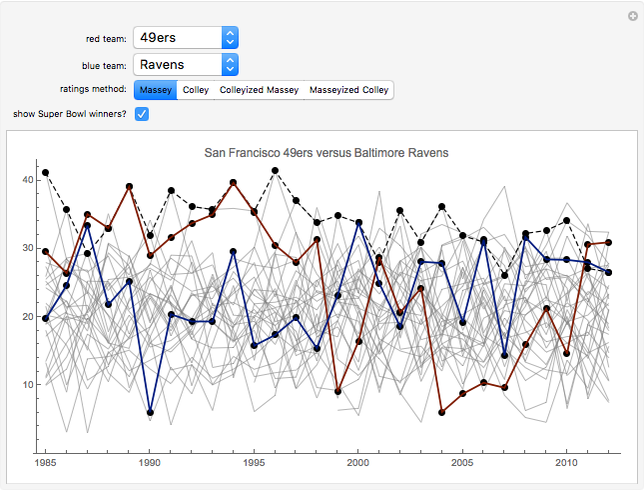
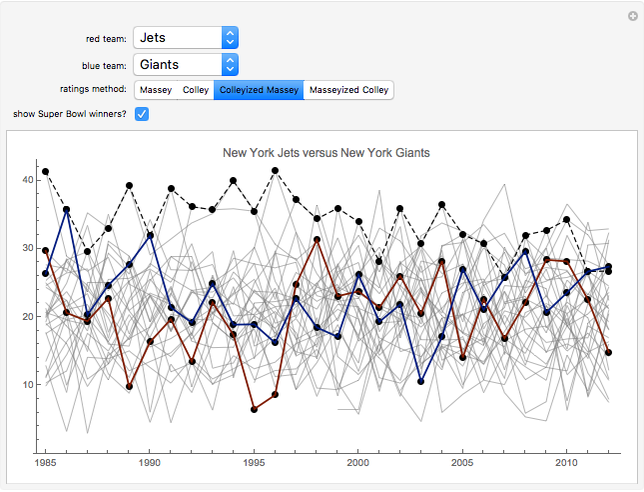
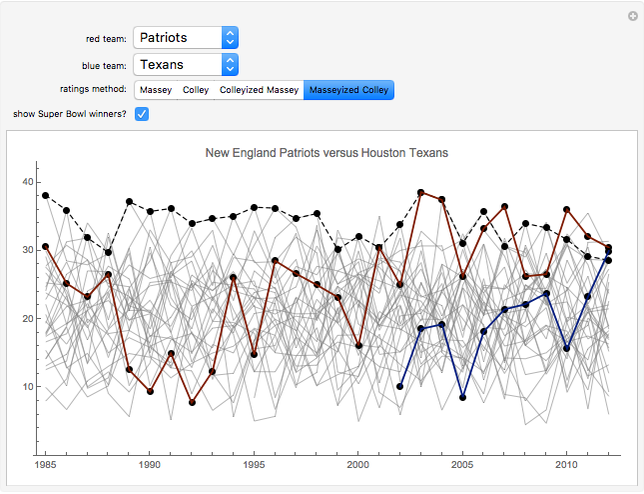
There are numerous ways to decide which teams were better than others in a given year, and this Demonstration shows four methods across 28 seasons of American professional football. Massey's method relies on points scored and points allowed, and the overall difficulty of the schedule. Colley's method also incorporates the strength of the schedule, but relies only on wins and not on points. One thing is clear: the 2007 and 2012 Giants are two of the worst teams to ever win the Super Bowl.
Contributed by: Kevin O'Bryant (February 2013)
City University of New York, College of Staten Island and The Graduate Center
Open content licensed under CC BY-NC-SA
Snapshots

Details
Let  be the Laplacian of the game graph; that is,
  is the number of games played between team
  and team
  , and
, and  is the number of games played by team . Let
  be the column vector whose
  component is the number of wins less the number of losses of team . Let
  be the column vector whose component is the number of points scored less the number of points allowed by team .
The Massey ratings are the vector  that solves the equation
  and whose components have mean 21 and standard deviation 7. The Colley ratings are given by the vector that solves the equation
  . The Colleyized Massey ratings are given by the vector that solves the equation
  . The Masseyized Colley ratings are the vector that solves the equation
  .
.
These four methods are detailed in the first chapters of [1].
Reference
[1] A. N. Langville and C. D. Meyer, Who's #1?, Princeton, NJ: Princeton University Press, 2012.
Permanent Citation
 2015-2016 AP Football Poll Using Alternative Voting Methods
Vivek Kaushik, Aubrey Laskowski, Matthew Romney, Yukun Tan Sports Scores
Ted Sanders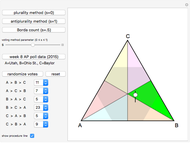 Three-Candidate Elections Using Saari Triangles
Matthew Romney, Yukun Tan, and Mengzhou Tang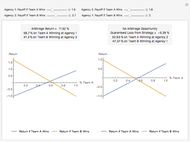 Sports Arbitrage: Two-Agency, Two-Outcome Efficient Pricing Test
Tom Stannard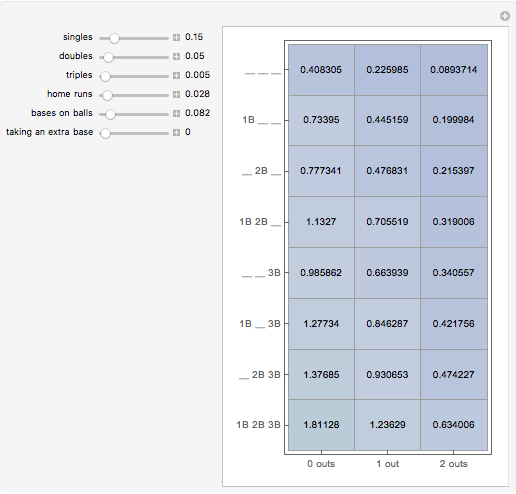 Run Expectancy Matrix in Baseball
Ben Dilday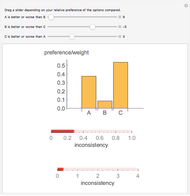 Preference Weights from Pairwise Comparisons
Johannes M. Lehner Random Values from Distributions
Chris Boucher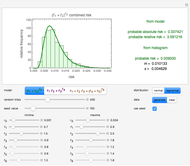 Assessing Total Risk from Interacting Factors
Mark D. Normand and Micha Peleg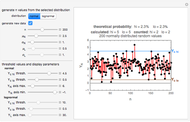 Failure Probabilities from Quality Control Charts
Mark D. Normand and Micha Peleg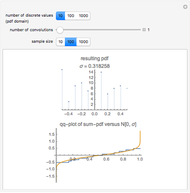 Simulating a Normal Process from Sums of Uniform Distributions
Jim Gerdy
