Reading Hertz's Own Dipole Theory
Initializing live version


Requires a Wolfram Notebook System
Interact on desktop, mobile and cloud with the free Wolfram Player or other Wolfram Language products.
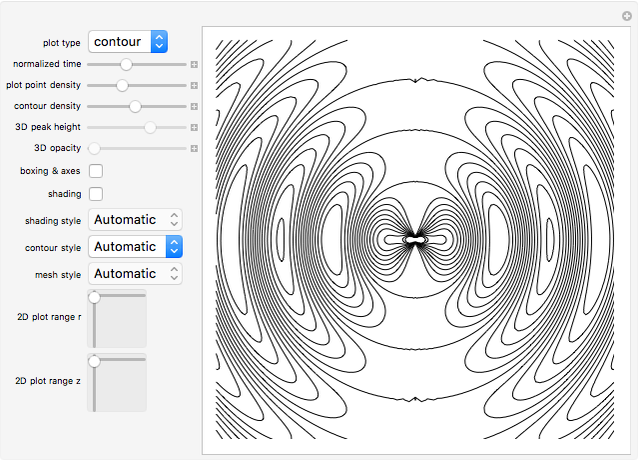
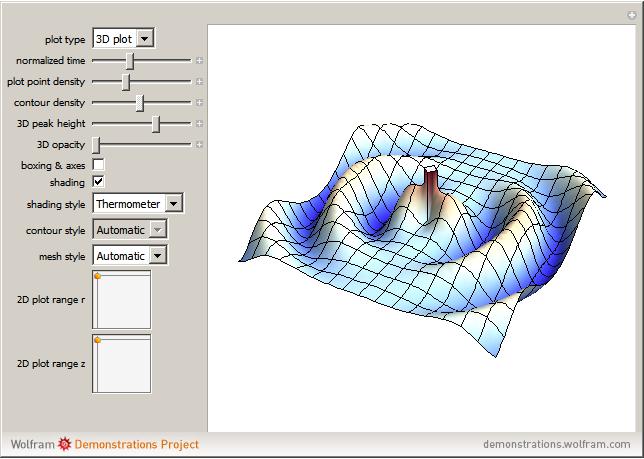
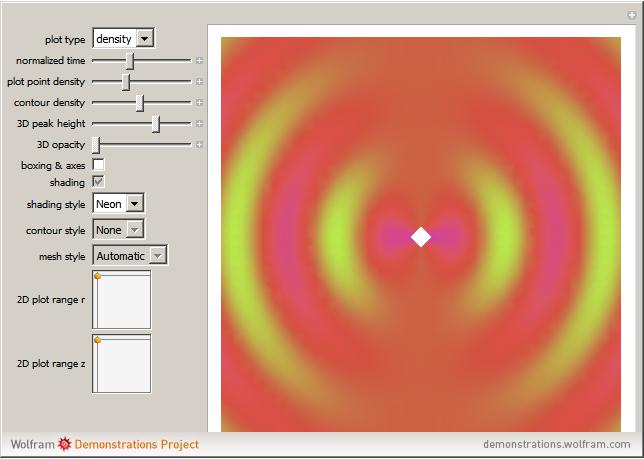
The plot depicts the time evolution of the lines of force of the electric field around a Hertzian dipole. It straightforwardly visualizes the function  (see Details for further information).


Contributed by: M V Babovic and V M Babovic (March 2011)
Open content licensed under CC BY-NC-SA
Snapshots
Details
Further information: Reading Hertz's Own Dipole Theory.
Permanent Citation
Related Demonstrations
More by Author
 Dipole Antenna Radiation Pattern
Nikolitsa Yannopoulou and Petros Zimourtopoulos (Antennas Research Group, Xanthi, Thrace, Hellas, EU) Electric Dipole Potential
Stephen Wolfram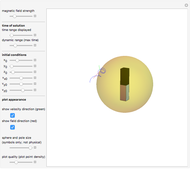 Dipole Fields Are Complicated
Jay Farrell (SAIC -- Huntsville, Alabama, USA)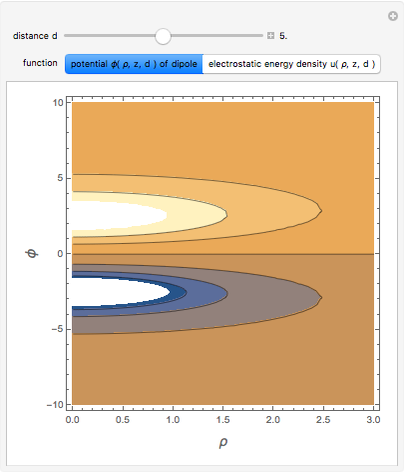 Energy Density of an Electrostatic Dipole
Franz Krafft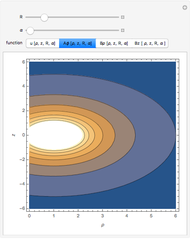 Energy Density of a Magnetic Dipole
Franz Krafft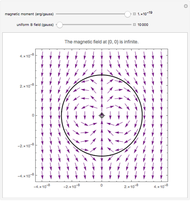 Magnetic Dipole in a Uniform Magnetic Field
Ernest Lee and Arvind Kannan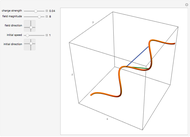 Charged Particle in a Uniform Magnetic Field
Jeff Bryant and Oleksandr Pavlyk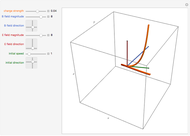 Charged Particle in Uniform Electric and Magnetic Fields
Jeff Bryant and Oleksandr Pavlyk Magnetic Braking
S. M. Blinder Electromagnetic Ring Toss
S. M. Blinder