Dipole Antenna Radiation Pattern

Requires a Wolfram Notebook System
Interact on desktop, mobile and cloud with the free Wolfram Player or other Wolfram Language products.
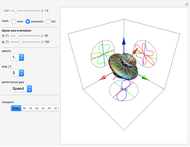
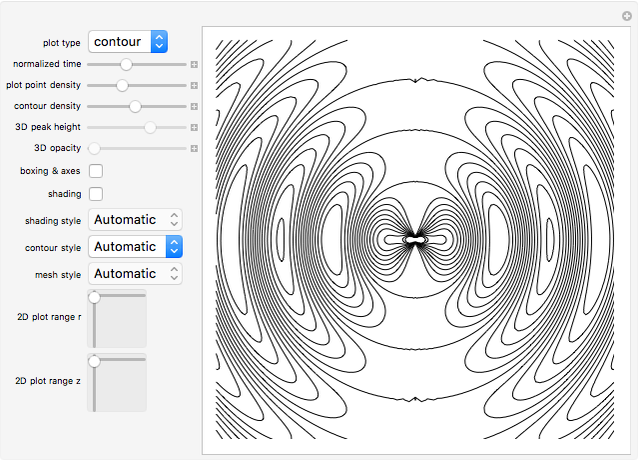
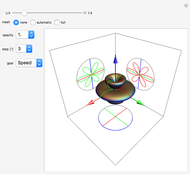
This Demonstration plots the normalized E-radiation pattern of a center-fed linear dipole antenna with sinusoidal current distribution on the  axis. Three of the sides of the cube correspond to intersections with the coordinate planes. There is a one-to-one correspondence between
  ,
,  ,
,  and the colors red, green, blue. The length/wavelength (Lpwl) of the dipole ranges from 0.1 to 10 in steps of 0.1. The default 3D evaluation is done at every 3°. 2D evaluation is always carried out at 1°. A small delay may be needed to get a smooth overall picture.
Contributed by: Nikolitsa Yannopoulou and Petros Zimourtopoulos (Antennas Research Group, Xanthi, Thrace, Hellas, EU) (March 2011)
Open content licensed under CC BY-NC-SA
Snapshots
Details
The normalized radiation pattern for the electric field of a symmetrical center-fed linear dipole antenna on the  axis with sinusoidal current distribution is given by:
 , where
  ,
,  .
.
 is the second coordinate of the spherical system (
 ,
,  ,
,  ), with 0 at
  axis and
  at -
at - (this is the variable t in the RadiationPattern function).
  is the total length per wavelength of the dipole (Lpwl variable).
  is the maximum value of
  for each one dipole. So,
Mesh and Opacity controls correspond to the well-known options of Mathematica 7, while the goal control stands for Mathematica's PerformanceGoal.
The "step [°]" control changes the number of plot points for the 3D radiation pattern. The initial value of 3° results in a smooth object. SphericalPlot3D was chosen, instead of RevolutionPlot3D or ParametricPlot3D, since it was faster.
Permanent Citation


