Trajectory of a Golf Shot


Requires a Wolfram Notebook System
Interact on desktop, mobile and cloud with the free Wolfram Player or other Wolfram Language products.
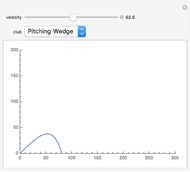
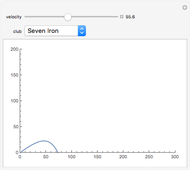
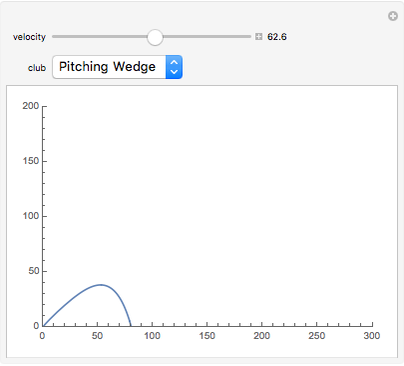
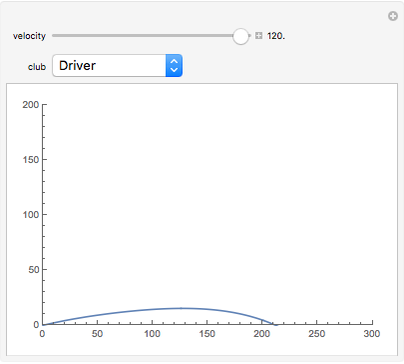
This Demonstration shows plots of the path of a golf ball after it is hit using one of nine different clubs. You can choose the club and the initial speed of the ball. Each axis is measured in yards and the initial speed is measured in yards/second. A driver gives a golf ball the greatest initial velocity while the higher-numbered irons cause a golf ball to have a successively lower initial velocity.
Contributed by: Ryan Kauss (June 2014)
Open content licensed under CC BY-NC-SA
Snapshots


Details
This Demonstration was written in Making Math.
References
[1] V. Aubuchon. "Golf Club Comparison Chart." (Jun 4, 2014) www.vaughns-1-pagers.com/sports/golf-club-data.htm.
[2] H. Erlichson. "Maximum Projectile Range with Drag and Lift, with Particular Application to Golf." (Jun 16, 1982) ww2.odu.edu/~agodunov/teaching/phys420/files/Erlichson.pdf.
Permanent Citation
"Trajectory of a Golf Shot"
http://demonstrations.wolfram.com/TrajectoryOfAGolfShot/
Wolfram Demonstrations Project
Published: June 17 2014
 Yoga Poses
Enrique Zeleny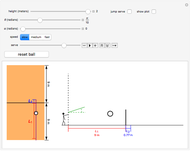 Volleyball Serves
Jenny Li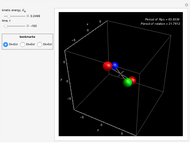 Dzhanibekov Effect
Arkadiusz Jadczyk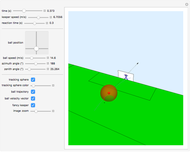 Soccer Penalty Kicks
Daniel Classon and Josh Seidman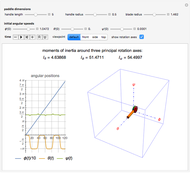 The Intermediate Axis Theorem Applied to a Ping-Pong Paddle Flip-Over
Erik Mahieu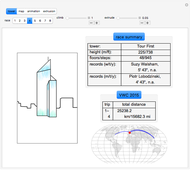 Vertical World Circuit 2015
Guenther Gsaller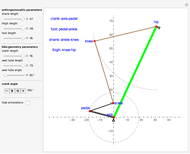 Five-Bar Linkage Model of the Bicycle-Rider System
Erik Mahieu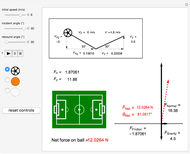 Forces on a Bouncing Ball
Anissa Dadkhah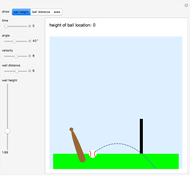 Angle and Velocity of Batted Baseball
David Lee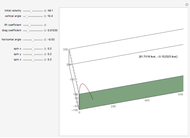 Flight of a Golf Ball
Benson R. Sundheim
