Visualizing Conway's Game of Life


Requires a Wolfram Notebook System
Interact on desktop, mobile and cloud with the free Wolfram Player or other Wolfram Language products.
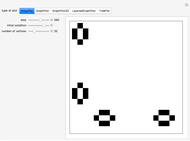
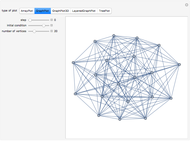
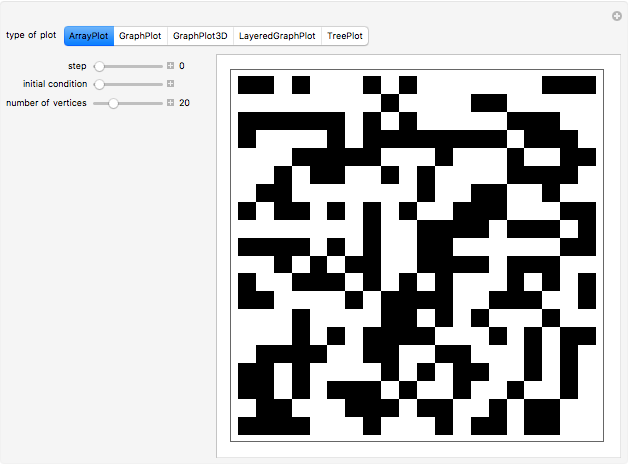
What do Conway's game of life and graph theory have in common? They both can be represented by binary matrices: in Conway's game of life, a 1 represents a live cell (black) and a 0 represents a dead cell (white); likewise, a graph can be represented by its adjacency matrix, where a 0 or 1 represents no link or a link between two nodes, respectively. Applying a nine-cell two-dimensional outer totalistic rule on a random binary square matrix simulates the evolution of the game of life as well as the evolution of a random network. Thus, although the underlying rule is identical in each case, the computation can be represented graphically in many different ways.
Contributed by: Bichara Sahely (December 2018)
Based on a program by: Luca Zammataro
Open content licensed under CC BY-NC-SA
Details
Snapshots


Permanent Citation
 Real-Time Simulation of the Game of Life
Hiroki Sayama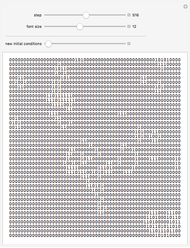 An ASCII Game of Life
Luca Zammataro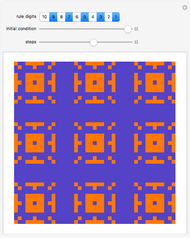 Modify Simple Life
Michael Schreiber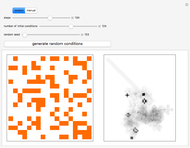 Game of Life with Random Initial Conditions
John Qiu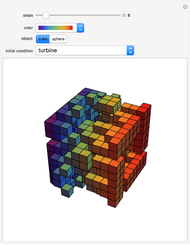 Game of Life in 3D Layers
Daniel de Souza Carvalho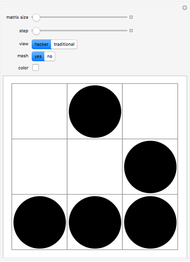 Hacker's Symbol: The Glider in the Game of Life
Daniel de Souza Carvalho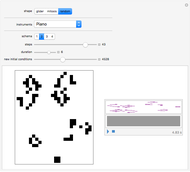 Music from the Game of Life
Luca Zammataro Voter Model
Ed Pegg Jr Sorted Evolutions of Cellular Automata
Michael Schreiber Pascal-like Triangles Made from a Game
Hiroshi Matsui, Toshiyuki Yamauchi, Daisuke Minematsu, and Ryohei Miyadera
