Contagion in a Grid and a Random Network


Requires a Wolfram Notebook System
Interact on desktop, mobile and cloud with the free Wolfram Player or other Wolfram Language products.
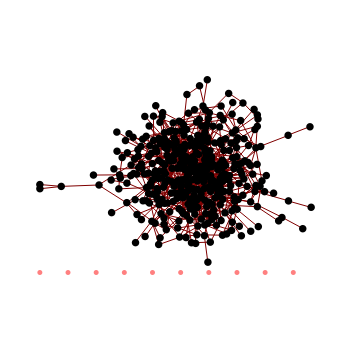
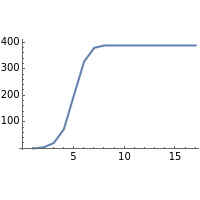
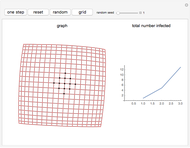
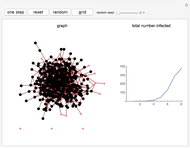
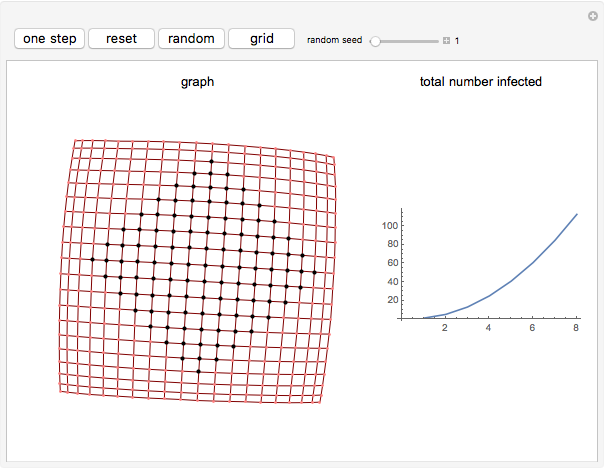
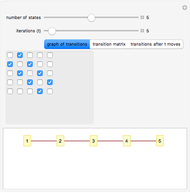
This Demonstration illustrates contagion in two different types of networks, a grid and a random network. In both types, one individual among 400 is infected. At each step, all the contacts of an infected individual become infected. There are an equal number of edges in the grid and the random graph. Plots show the total number infected and the number of newly infected at each stage. Use the "reset" button to reset to the initial conditions.
Contributed by: Phillip Bonacich (September 2013)
Open content licensed under CC BY-NC-SA
Snapshots


Details
detailSectionParagraphPermanent Citation
"Contagion in a Grid and a Random Network"
http://demonstrations.wolfram.com/ContagionInAGridAndARandomNetwork/
Wolfram Demonstrations Project
Published: September 20 2013
 Contagion in Random and Scale-Free Networks
Phillip Bonacich Simulated Epidemics in Random Networks of Varying Density and Size
Phillip Bonacich Measures of Network Centrality
Phillip Bonacich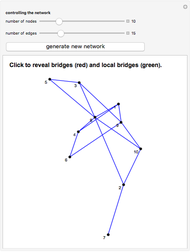 Find Bridging Edges in Networks
Phillip Bonacich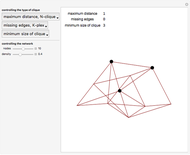 Finding Cliques in Networks
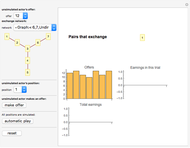
Phillip Bonacich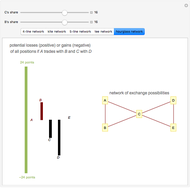 The Power-Dependence Solution to Five Exchange Networks
Phillip Bonacich Dynamical Network Design for Controlling Virus Spread
Mengran Xue, Yan Wan, Sandip Roy, and Ali Saberi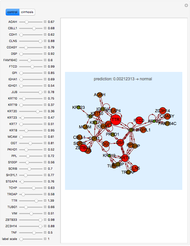 Sensitivity Analysis of Transition Phases of Perturbed Gene Pathways with a Neural Network
Luca Zammataro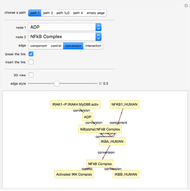 Handling Molecular Pathways in Systems Biology
Luca Zammataro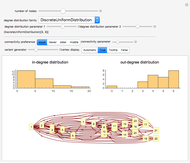 Random Acyclic Networks
Seth J. Chandler
-
Contagion in Random and Scale-Free Networks
Phillip Bonacich -
Find Bridging Edges in Networks
Phillip Bonacich -
Finding Cliques in Networks
Phillip Bonacich -
 Exchange Networks
Phillip Bonacich -
 Contagion in a Grid and a Random Network
Phillip Bonacich -
Measures of Network Centrality
Phillip Bonacich -
 N-Step Transition Matrices for Markov Chains
Phillip Bonacich -
The Power-Dependence Solution to Five Exchange Networks
Phillip Bonacich -
Simulated Epidemics in Random Networks of Varying Density and Size
Phillip Bonacich