Cross Sections of Graphs of Functions of Two Variables


Requires a Wolfram Notebook System
Interact on desktop, mobile and cloud with the free Wolfram Player or other Wolfram Language products.
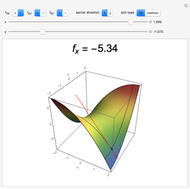
The graph of a function of two variables  can be better understood by looking at slices, or cross sections, of the graph parallel to the
  or
or  planes. Slicing is equivalent to holding
  (or
(or  ) constant at
  and looking at the graph of the resulting single-variable function
  (or
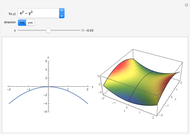
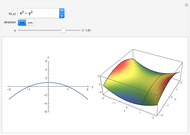
(or  , respectively). This Demonstration helps students connect the slice on the 3D graph of
  with the 2D graph of
  or
or  in its own right.
Contributed by: Joshua Sabloff and Stephen Wang (Haverford College) (March 2011)
Open content licensed under CC BY-NC-SA
Snapshots


Details
detailSectionParagraphPermanent Citation
"Cross Sections of Graphs of Functions of Two Variables"
http://demonstrations.wolfram.com/CrossSectionsOfGraphsOfFunctionsOfTwoVariables/
Wolfram Demonstrations Project
Published: March 7 2011
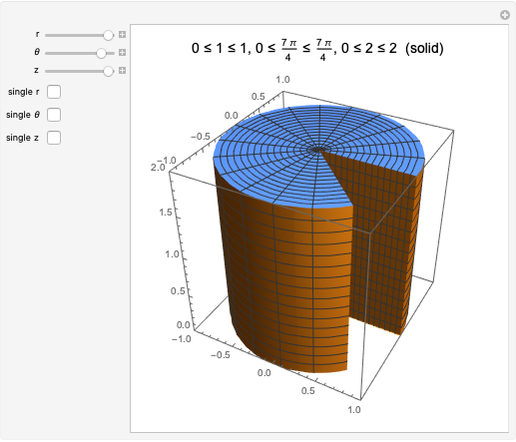 Exploring Cylindrical Coordinates
Faisal Mohamed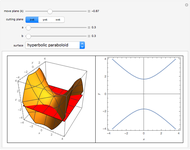 Plane Sections of Surfaces
Germán Alvarado Jiménez Elliptic Hyperboloid of Two Sheets
Jeff Bryant Soap Film between Two Equal and Parallel Rings
S. M. Blinder Surface Integrals over Segments of Parametrized Surfaces
Michael Rogers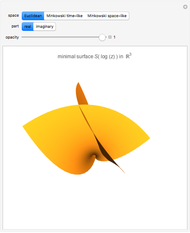 Minimal and Maximal Surfaces Generated by the Holomorphic Function log(z)
Georgi Ganchev and Radostina Encheva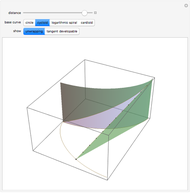 Unwrapping Involutes
Michael Rogers (Oxford College of Emory University)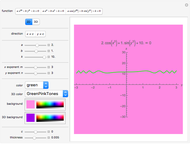 Graphs and Sections of Some Polynomial, Exponential, and Trigonometric Functions
Marta Elorza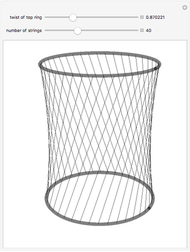 Hyperboloid as a Ruled Surface
Bruce Atwood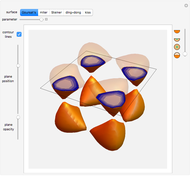 Contours of Algebraic Surfaces
Yu-Sung Chang