Engineering-Style Smith Chart


Requires a Wolfram Notebook System
Interact on desktop, mobile and cloud with the free Wolfram Player or other Wolfram Language products.
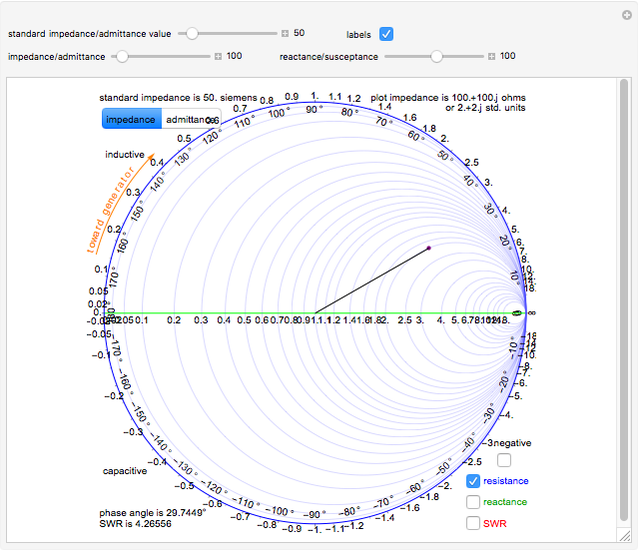
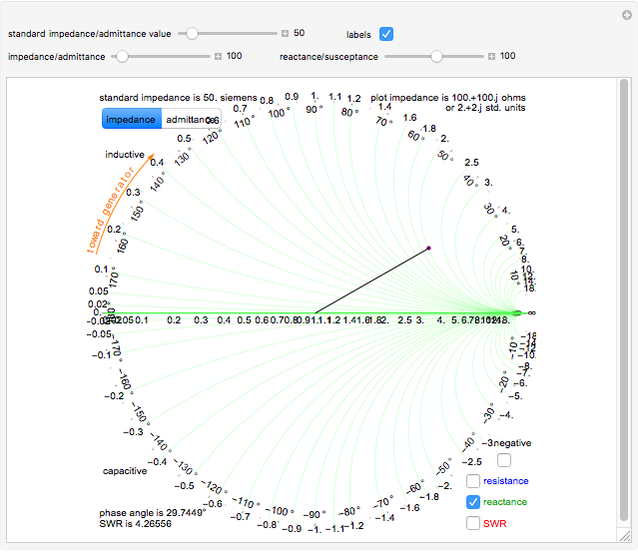
A Smith chart is a conformal mapping of the complex plane to the complex plane such that the non-negative resistance or conductance half-plane is mapped onto a unit circle. Excepting cases where circuits with gain are being analyzed, all plotting occurs in the non-negative half-plane, permitting a compact nomogram for plotting and computing impedances and admittances. Resistances (conductances) and reactances (suspectances) are normalized by the standard resistance (conductance), which is plotted as 1 on the zero reactance (suspectance) line.
Contributed by: Randolph J. Herber, W9HE (May 2013)
After work by: Phillip H. Smith
Open content licensed under CC BY-NC-SA
Snapshots
Details
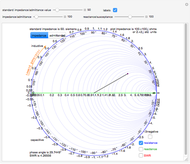
Snapshot 1: This shows resistance circles; the dark blue circle is the zero resistance (conductance) "line." The resistance (conductance) circles have radii  , where
  is the standardized resistance (conductance), with centers on the zero resistance (conductance) line and touching the infinite resistance (conductance) point.
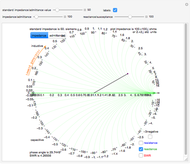
Snapshot 2: This shows reactance arcs; the horizontal line is zero reactance (suspectance). The reactance (suspectance) arcs are parts of circles with radii the reciprocals of the reactances (suspectances). The circles are tangent to the zero reactance (suspectance) line and touch the infinite resistance (conductance) point.
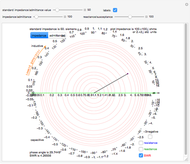
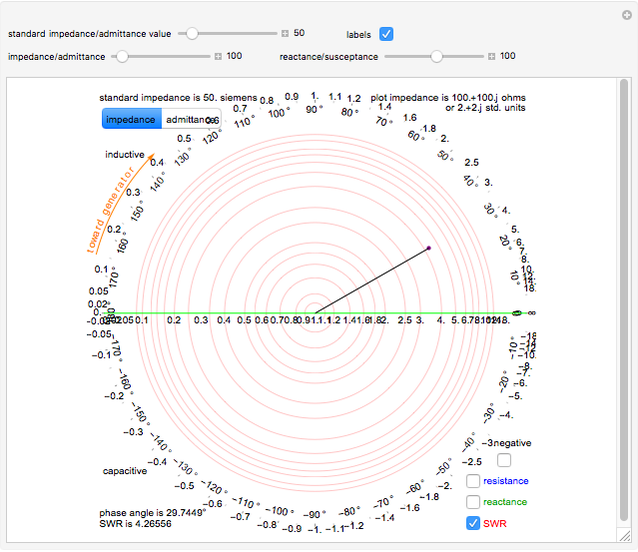
Snapshot 3: This shows SWR circles. The circles are centered on the standard resistance (conductance) point. Their radii are  , where is the SWR ratio. The SWR ratios are greater or equal to 1.
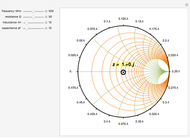
Snapshot 4: a simple form of the Smith chart showing some the negative impedance region
Snapshot 5: a simple form of the Smith chart showing some the negative admittance region
Quoted from the English Wikipedia [2]: "The Smith chart, invented by Phillip H. Smith (1905–1987), is a graphical aid or nomogram designed for electrical and electronics engineers specializing in radio frequency (RF) engineering to assist in solving problems with transmission lines and matching circuits. Use of the Smith chart utility has grown steadily over the years and it is still widely used today, not only as a problem-solving aid, but as a graphical demonstrator of how many RF parameters behave at one or more frequencies, an alternative to using tabular information. The Smith chart can be used to simultaneously display multiple parameters including impedances, admittances, reflection coefficients,  , scattering parameters, noise figure circles, constant gain contours, and regions for unconditional stability, including mechanical vibrations analysis. The Smith chart is most frequently used at or within the unity radius region. However, the remainder is still mathematically relevant, being used, for example, in oscillator design and stability analysis."
The orange "toward generator" arrow is a reminder of how cable length affects the appearance of an impedance at the far end of a cable to a generator (transmitter) at the near end of the cable. Because a signal goes from the generator to the far end and then returns to the transmitter, the length of the cable is measured by the wave length of the signal scaled by the wave propagation speed (velocity factor). In a vacuum, the velocity factor is 1; in air, it is very close to 1; and in typical coaxial cables, it is about 0.7. For example, a half-wave length cable open at the far end appears to the generator as a short, which easily could damage the generator.
The chart looks better when larger. It is sized this small to accommodate small screens. To enlarge the image, first drag a corner of the window and drag it to be larger. Then click the image. A red line appears enclosing the image, which you can drag by any of the small red squares on the border.
References
[1] P. H. Smith, Electronic Applications of the Smith Chart, New York: McGraw-Hill, 1969.
[2] Wikipedia. "Smith Chart." (Mar 13, 2013) en.wikipedia.org/wiki/Smith_chart.
[3] S. D. Stearns, K6OIK, "Mysteries of the Smith Chart: Transmission Lines, Impedance Matching, and Little Known Facts," presentation given at Pacificon 2001, Concord, CA. https://www.google.ca/url?sa=t&rct=j&q=&esrc=s&source=web&cd=1&cad=rja&uact=8&ved=0CB0QFjAAahUKEwiU7JrTuubIAhXGaz4KHYFwDqQ&url=http%3A%2F%2Farchive.k6ya.org%2Fdocs%2Fsmith_chart.pdf&usg=AFQjCNE8ZqPj9jvTN4pZtYKKjcVEXTM02g&sig2=XjmqOz4dfeT7xi59GJVo9Q.
[4] F. Caspers, "RF Engineering Basic Concepts: The Smith Chart." (Jan 19, 2012) arxiv.org/abs/1201.4068.
[5] Wikipedia. "Conformal Map." (Feb 22, 2013) en.wikipedia.org/wiki/Conformal_map.
[6] R. J. Herber, "Chapter 6: Notes for the Amateur Radio Extra Class License Manual," in ARRL Extra Class License Manual, 10th ed., Newington, CT: The American Radio Relay League, 2012. www.arrl.org/files/file/Instructor%20 resources/Herber%20 W9HE/notes2012.pdf.
[7] ARRL Extra Class License Manual, 10th ed., Newington, CT: The American Radio Relay League, 2012.
Permanent Citation
 The Smith Chart
S. M. Blinder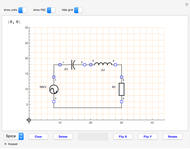 SPICE Program for Electronic Circuits
George Irwin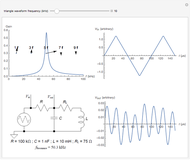 RLC Tank Circuit Bandpass Filter: Triangle Waveform Input
Michael R. Braunstein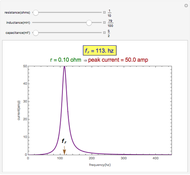 Frequency Response of an LCR Circuit
Contributed by: Kallol Das (St. Aloysius College, Jabalpur, India)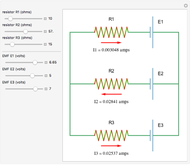 Three-Branch Electrical Circuit
Darya Aleinikava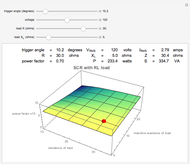 AC Thyristor Trigger Angle versus Power Factor
Harley H. Hartman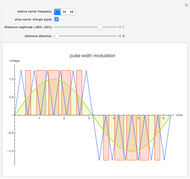 Pulse Width Modulation Principle
Harley H. Hartman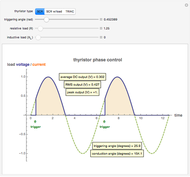 AC Thyristor Operation
Harley H. Hartman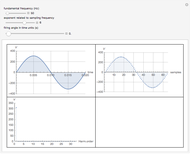 Digital Determination of Output Voltage Harmonics in a Single-Phase Voltage Controller
GISENER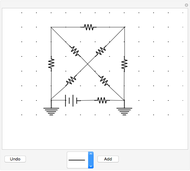 Draw Your Own Electrical Circuit
Enrique Zeleny
