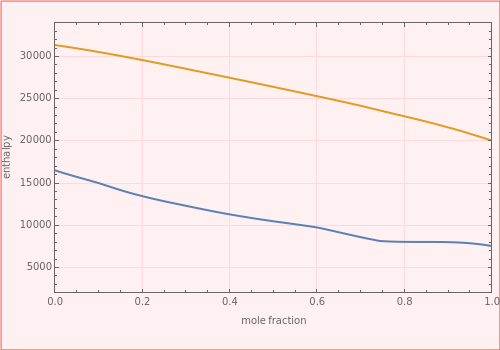
Enthalpy versus Composition Diagram for n-Hexane/n-Octane at 101 kPa


Requires a Wolfram Notebook System
Interact on desktop, mobile and cloud with the free Wolfram Player or other Wolfram Language products.
Consider a binary mixture composed of  -hexane and
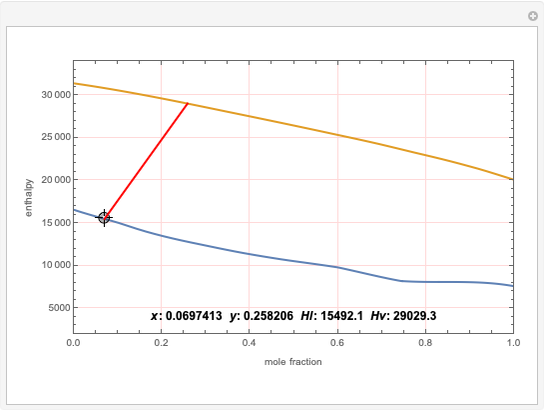
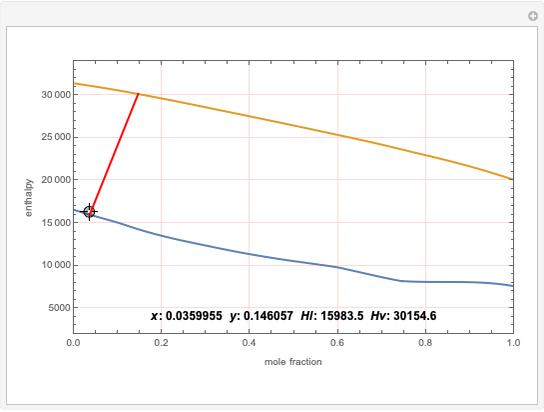
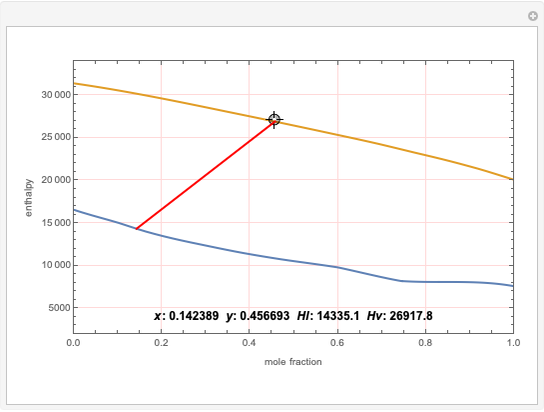
  -octane; this Demonstration uses Henley and Seader's data to plot the enthalpy versus composition diagram at 101 kPa. The curves are the liquid (
 , in blue) and vapor (
 , in magenta) enthalpy versus the liquid (
 ) and vapor (
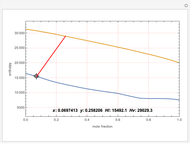
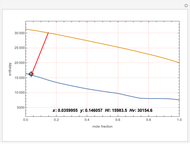
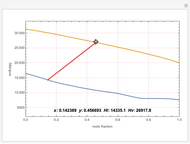
 ) mole fraction curves. Click either curve to place the locator there. Then the vapor-liquid and enthalpy data is displayed as text at the bottom and the tie line is plotted in red.
Contributed by: Housam Binous (March 2011)
Open content licensed under CC BY-NC-SA
Snapshots
Details
E. J. Henley and J. D. Seader, Equilibrium-Stage Separation Operations in Chemical Engineering, New York: Wiley, 1981.
Permanent Citation
 Pinch Composition versus Reflux Ratio for a Benzene-Ethylenediamine Mixture at 1 atm
Housam Binous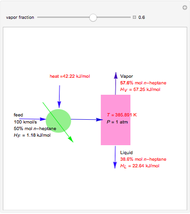 Flash Vaporization of a Heptane-Octane Mixture
Housam Binous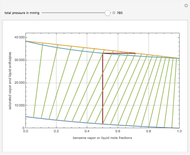 Enthalpy-Concentration Plot for a Benzene-Toluene Binary Mixture
Housam Binous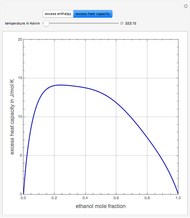 Excess Enthalpy and Heat Capacity for an Ethanol-Water Mixture
Housam Binous and Brian G. Higgins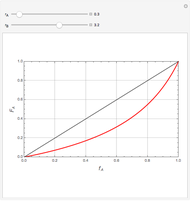 Mayo-Lewis Model for Copolymer Composition
Mamdouh Al-Harthi and Housam Binous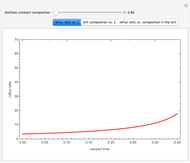 Reflux Policy for a Batch Distillation Operation with a Constant Distillate Composition
Housam Binous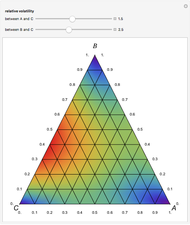 Composition of Vapor and Liquid Phases for a Ternary Ideal Mixture
Housam Binous, Brian G. Higgins, and Ahmed Bellagi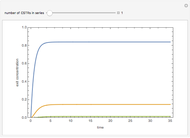 Transient Behavior of N CSTRs in Series with Chemical Reaction
Housam Binous and Ahmed Bellagi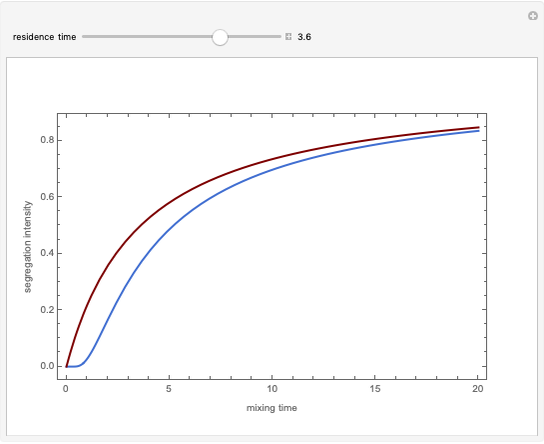 Mixing and Segregation in Chemical Reactors (CSTR versus PFR)
Housam Binous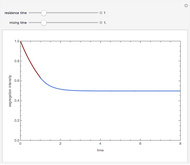 Intensity of Segregation versus Time in a Semi-Continuous Reactor
Housam Binous