Frequency Spectrum of a Noisy Signal


Requires a Wolfram Notebook System
Interact on desktop, mobile and cloud with the free Wolfram Player or other Wolfram Language products.
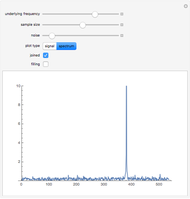
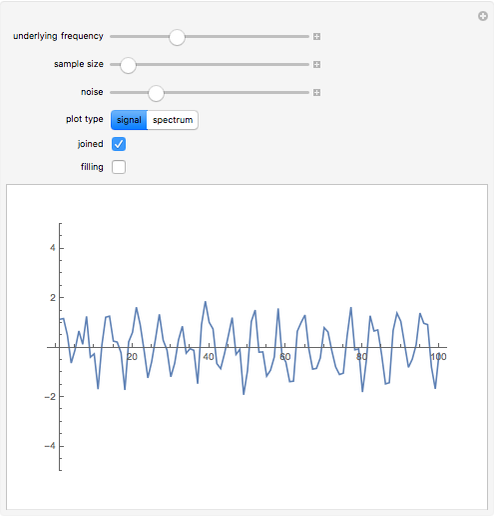
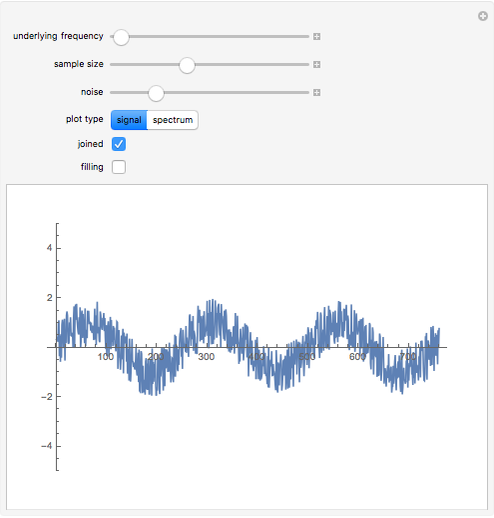
This Demonstration generates a sine wave signal with random noise. You can visualize a plot of the signal's amplitude or its frequency spectrum. The frequency spectrum is calculated using the discrete Fourier transform of sampled amplitude values.
Contributed by: Jon McLoone (March 2011)
Open content licensed under CC BY-NC-SA
Snapshots


Details
detailSectionParagraphPermanent Citation
"Frequency Spectrum of a Noisy Signal"
http://demonstrations.wolfram.com/FrequencySpectrumOfANoisySignal/
Wolfram Demonstrations Project
Published: March 7 2011
 Beat Frequency of Sound Waves
Christopher Engberg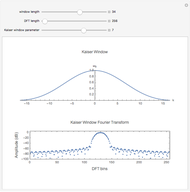 Kaiser Window Transform
Jeff Bryant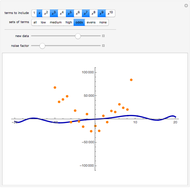 Fitting Noisy Data
Rob Morris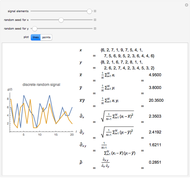 Correlation and Covariance of Random Discrete Signals
Daniel de Souza Carvalho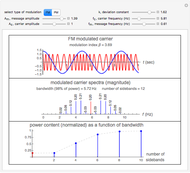 Power Content of Frequency Modulation and Phase Modulation
Nasser M. Abbasi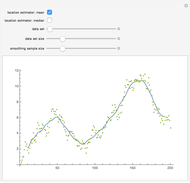 Data Smoothing
Jon McLoone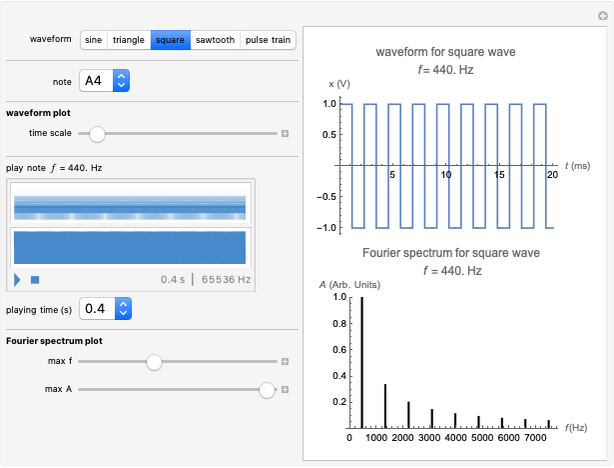 Sounds of Waveforms
Marilyn F. Bishop (Virginia Commonwealth University, Department of Physics and Center for the Study of Biological Complexity, Richmond, Virginia)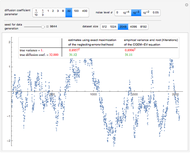 Estimating a Centered Ornstein-Uhlenbeck Process under Measurement Errors
Didier A. Girard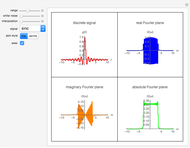 Complex and Real Planes of Discrete Fourier Transforms
Daniel de Souza Carvalho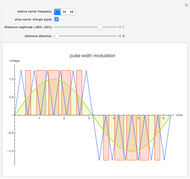 Pulse Width Modulation Principle
Harley H. Hartman
-
Beat Frequency of Sound Waves
Jon McLoone -
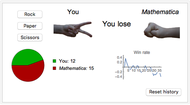 Rock, Paper, Scissors with AI Player
Jon McLoone -
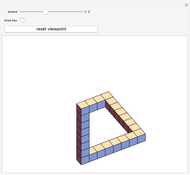 Near-Penrose Shapes
Jon McLoone -
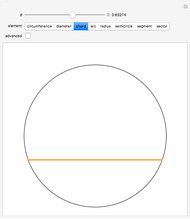 Geometric Elements of a Circle
Jon McLoone -
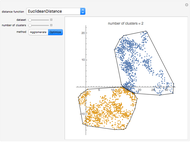 Cluster Analysis
Jon McLoone -
 Picture Puzzle
Jon McLoone -
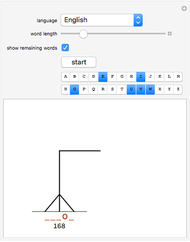 Hangman Word Game for a Human Player
Jon McLoone -
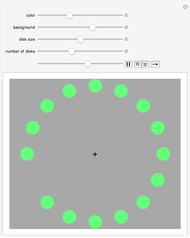 What Color is the Moving Circle?
Jon McLoone -
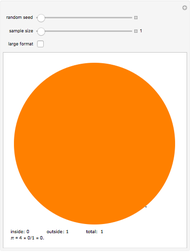 Monte Carlo Estimate for Pi
Jon McLoone -
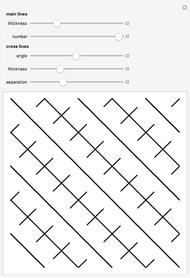 Are the Lines Parallel?
Jon McLoone -
Data Smoothing
Jon McLoone -
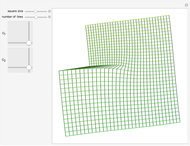 Conformal Map of Exponential
Jon McLoone -
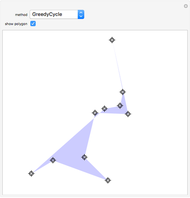 Traveling Salesman Problem
Jon McLoone -
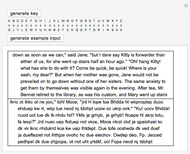 Cipher Encoder
Jon McLoone -
 Slider Puzzle
Jon McLoone -
 Interior Angles of a Triangle
Jon McLoone -
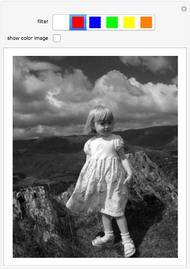 Color Filters in Black and White Photography
Jon McLoone -
 Contrast Illusion
Jon McLoone -
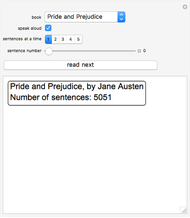 Book Reader
Jon McLoone -
 Populations of Cities
Jon McLoone