How Increasing the Money Supply Affects the Economy

Requires a Wolfram Notebook System
Interact on desktop, mobile and cloud with the free Wolfram Player or other Wolfram Language products.
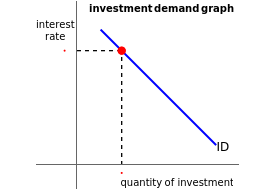
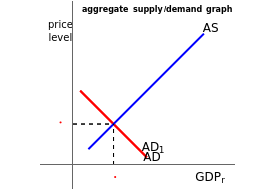
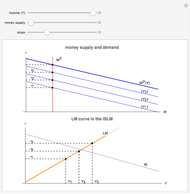
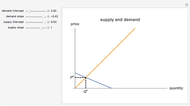
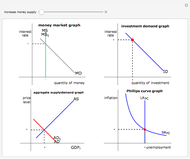
This Demonstration shows the implications for the economy if the money supply is increased. It uses the four key graphs taught in AP Macroeconomics. Initially, this change decreases interest rates, as seen on the money market graph. This increases the quantity of investment, shown on the investment demand graph, which increases aggregate demand. The increase in price level causes inflation and reduced unemployment, shown on the Phillips curve graph.
[more]
Contributed by: Matthew Rosenfield (February 2018)
Open content licensed under CC BY-NC-SA
Snapshots
Details
There are a couple of caveats with regard to the Demonstration. This is how macroeconomics is taught at the high-school level; however, events like the Great Depression of 1929–1936 and the Great Recession of 2007–2014 suggest otherwise. The diagrams in the Demonstration are true when the markets are at equilibrium, there is sufficient slack in employment, and interest rates are above the zero lower bound.
Reference
[1] C. R. McConnell and S. L. Brue, Economics: Principles, Problems, and Policies, 17th ed., Boston: McGraw-Hill Irwin, 2008.
This was a project for Advanced Topics in Mathematics II, 2017-2018, Torrey Pines High School, San Diego, CA.
Permanent Citation
"How Increasing the Money Supply Affects the Economy"
http://demonstrations.wolfram.com/HowIncreasingTheMoneySupplyAffectsTheEconomy/
Wolfram Demonstrations Project
Published: February 15 2018

