Keeling Curve for Atmospheric Carbon Dioxide


Requires a Wolfram Notebook System
Interact on desktop, mobile and cloud with the free Wolfram Player or other Wolfram Language products.
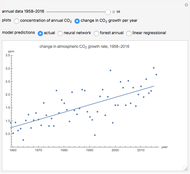
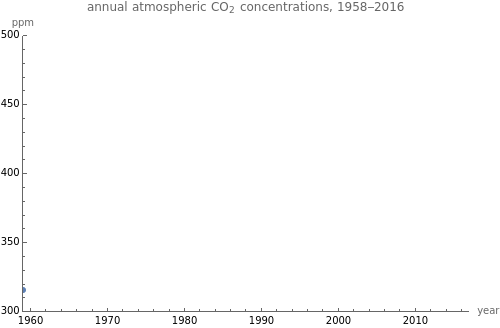
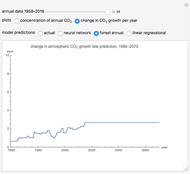
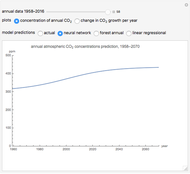
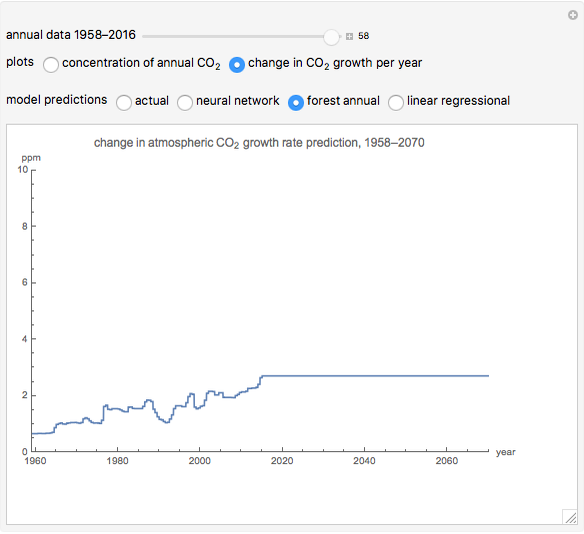
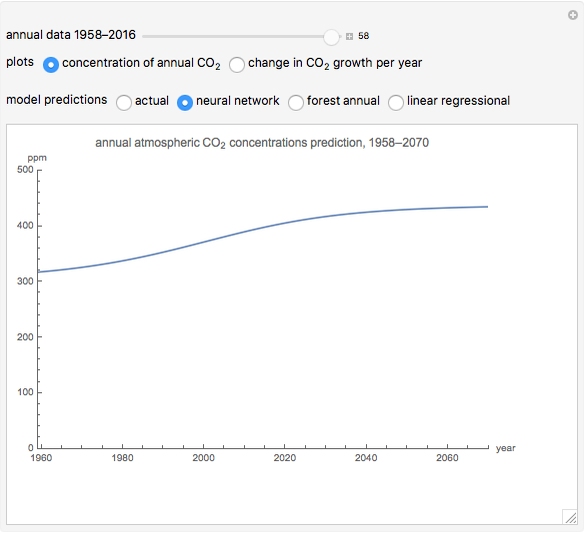
This Demonstration plots the Keeling curve for the concentration of  in the atmosphere (in parts per million), from 1958 to 2016, using data courtesy of NOAA [1]. It also includes a plot of the change of
  growth per year and some model predictions to 2070, including neural network, random forest and linear regression.
Contributed by: Frank Lee (February 2017)
With additional contributions by: Shishir Reddy
Open content licensed under CC BY-NC-SA
Snapshots


Details
This was a project for Advanced Topics in Mathematics II, 2016–2017, Torrey Pines High School, San Diego, CA.
Data publicly available at [1].
Reference
[1] US Department of Commerce, National Oceanic and Atmospheric Administration. "Trends in Atmospheric Carbon Dioxide." (Feb 15, 2017) www.esrl.noaa.gov/gmd/ccgg/trends/data.html.
Permanent Citation
"Keeling Curve for Atmospheric Carbon Dioxide"
http://demonstrations.wolfram.com/KeelingCurveForAtmosphericCarbonDioxide/
Wolfram Demonstrations Project
Published: February 16 2017
 Short-Term Temperature Trends within Long-Term Warming
Jeffrey B. Weiss Sea Level
Michael Schreiber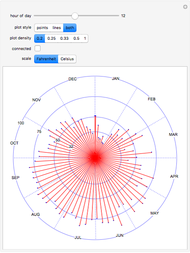 Polar Plot of a Year's Hourly Temperatures
Daniel G. Martinez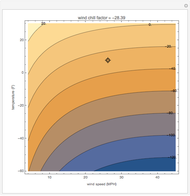 The Wind Chill Factor
Susana Gonzales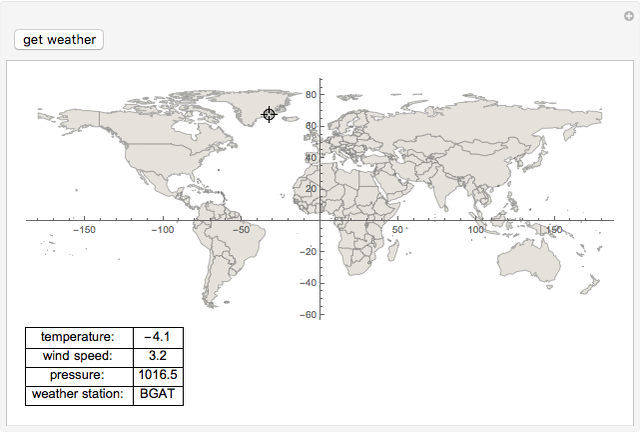 Weather Browser
Jon McLoone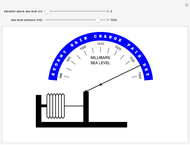 Aneroid Barometer
S. M. Blinder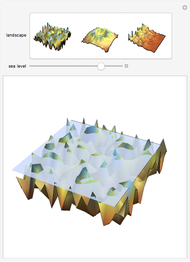 Changing Sea Levels
Herbert W. Franke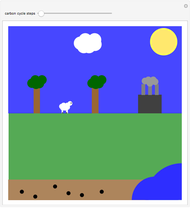 The Carbon Cycle
Nada Al-Alusi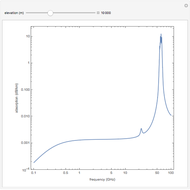 Atmospheric Radar Wave Absorption
Marshall Bradley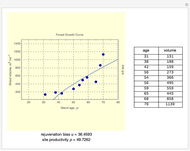 A Forest Growth Curve
Georgii Alexandrov