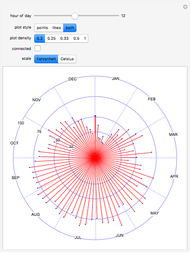
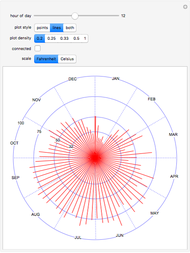
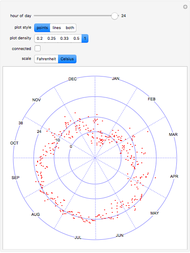
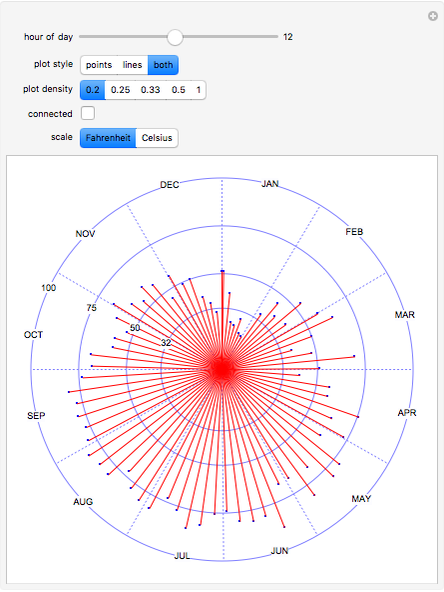
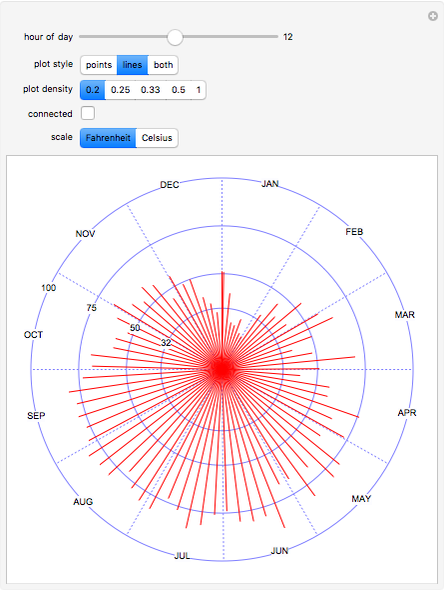
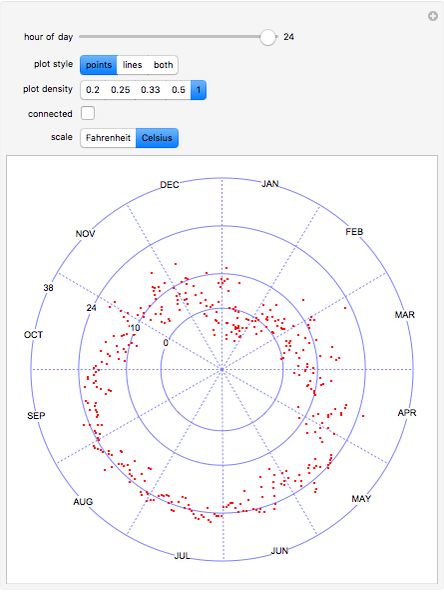
Polar Plot of a Year's Hourly Temperatures
Initializing live version


Requires a Wolfram Notebook System
Interact on desktop, mobile and cloud with the free Wolfram Player or other Wolfram Language products.
Hourly temperatures (°F) at Washington, DC for January 10 through December 31, 2004 are presented in a polar plot as radial lines or points. By moving the slider the magnitudes of all available temperatures for a specified hour of the day are presented as their distance from the plot's center.
Contributed by: Daniel G. Martinez (August 2008)
Open content licensed under CC BY-NC-SA
Snapshots
Details
Permanent Citation
Related Demonstrations
More by Author
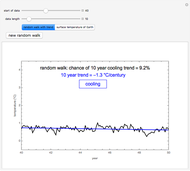 Short-Term Temperature Trends within Long-Term Warming
Jeffrey B. Weiss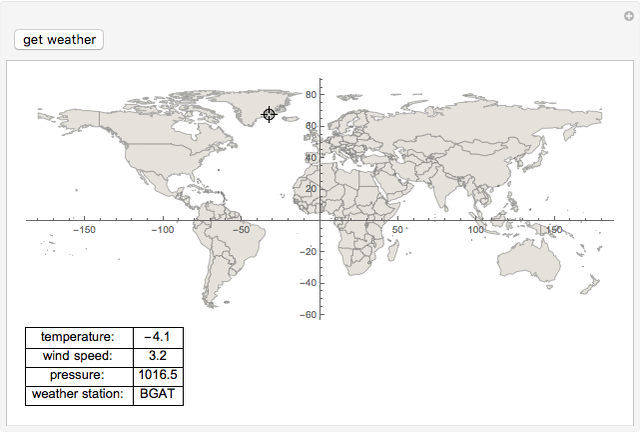 Weather Browser
Jon McLoone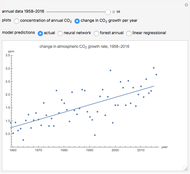 Keeling Curve for Atmospheric Carbon Dioxide
Frank Lee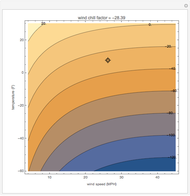 The Wind Chill Factor
Susana Gonzales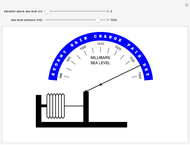 Aneroid Barometer
S. M. Blinder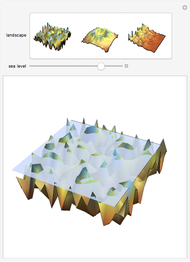 Changing Sea Levels
Herbert W. Franke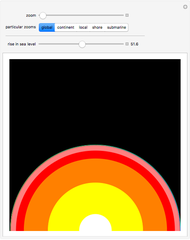 Sea Level
Michael Schreiber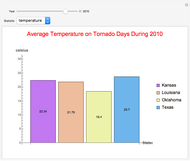 The Average Temperature, Humidity, and Windspeed of Tornadoes (2000-2012)
Keren Starobinski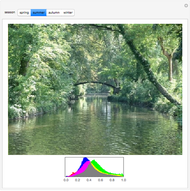 Image Histograms of the Four Seasons
Daniel de Souza Carvalho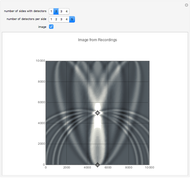 Kirchhoff Imaging
David von Seggern
-
 Polar Plot of a Year's Hourly Temperatures
Daniel G. Martinez -
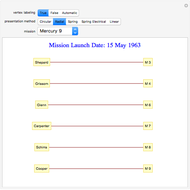 Networks of Space Flights by American Pre-Shuttle Astronauts
Daniel G. Martinez -
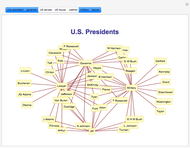
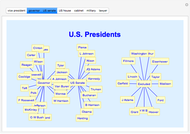 U.S. Presidential Interconnections and Exclusions
Daniel G. Martinez -
 U.S. Presidential Interconnections
Daniel G. Martinez -
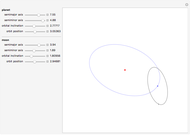 Prototype of a Virtual 2D Orrery
Daniel G. Martinez -
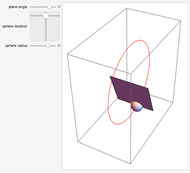 Rotating Plane with Intersecting Sphere and Circle
Daniel G. Martinez -
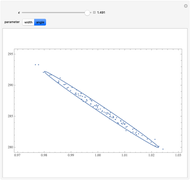 Monte Carlo Simulation of Line-of-Sight Distance Measurements
Daniel G. Martinez -
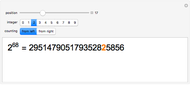 Von Neumann Exponent Calculator
Daniel G. Martinez