Matching Temperature Data to a Normal Distribution

Requires a Wolfram Notebook System
Interact on desktop, mobile and cloud with the free Wolfram Player or other Wolfram Language products.
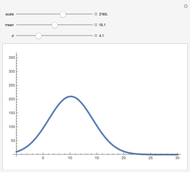
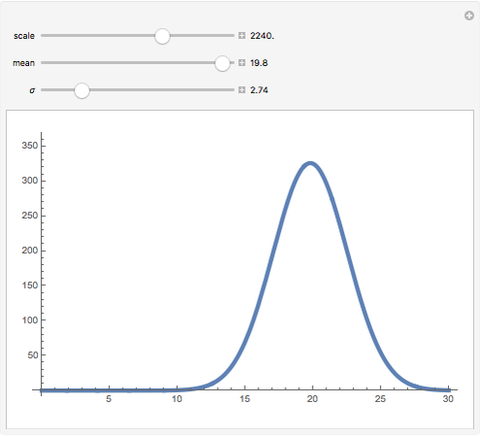
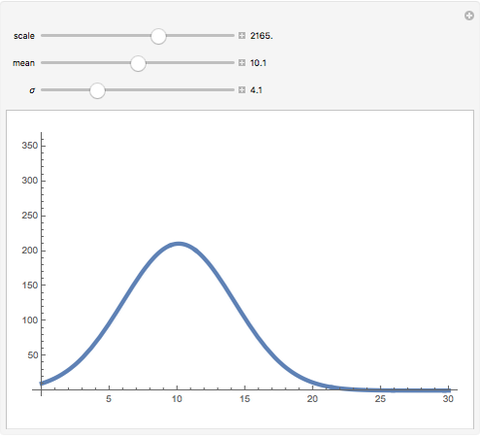
The temperature data for London over the summers from 1976 to 2010 is plotted as a histogram. Choose parameters to match a normal distribution curve to the histogram.
Contributed by: Trevor Cole (March 2011)
Open content licensed under CC BY-NC-SA
Snapshots


Details
detailSectionParagraphPermanent Citation
"Matching Temperature Data to a Normal Distribution"
http://demonstrations.wolfram.com/MatchingTemperatureDataToANormalDistribution/
Wolfram Demonstrations Project
Published: March 7 2011
 Impact of Sample Size on Approximating the Normal Distribution
Paul Savory (University of Nebraska-Lincoln) Sampling Distribution of the Mean and Standard Deviation in Various Populations
Ian McLeod Exploring Multivariate Data
Danny Turner (Winthrop University) Automatically Selecting Histogram Bins
Brett Champion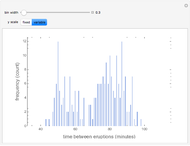 Bin Width and Histogram Shape
Jim Brandt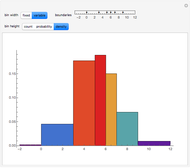 Effects of Bin Width and Height in a Histogram
Brett Champion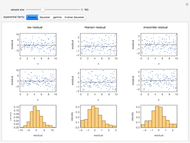 Comparing Some Residuals for Generalized Linear Models
Darren Glosemeyer Edgeworth Expansion for Near-Normal Data
Housam Binous, Mamdouh Al-Harthi, and Brian G. Higgins Fitting Data to a Lognormal Distribution
Michail Bozoudis Reverse Engineering GPA Distributions from Honors Data
Seth J. Chandler