Monopoly Model


Requires a Wolfram Notebook System
Interact on desktop, mobile and cloud with the free Wolfram Player or other Wolfram Language products.
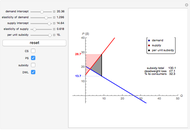
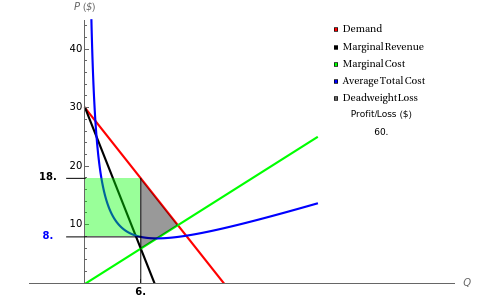
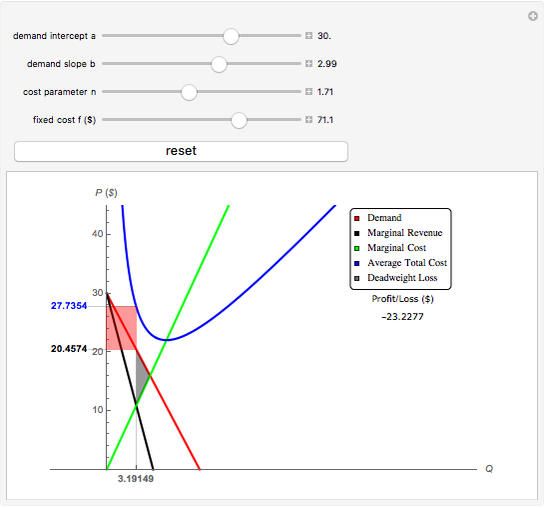
This Demonstration graphs a standard monopoly model. You can adjust the demand slope, demand intercept, fixed cost, and marginal cost. The monopoly price, cost per unit, optimal quantity, and total profit or loss are also displayed. Deadweight loss is displayed graphically.
Contributed by: David Youngberg (May 2011)
Based on a program by: Fiona Maclachlan
Open content licensed under CC BY-NC-SA
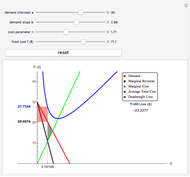
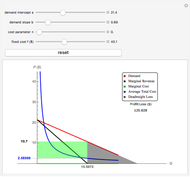
Snapshots

Details
This Demonstration illustrates the basic elements of a profit-maximizing monopoly, improving on a similar model by Fiona Maclachlan. Instead of choosing between three predetermined cost levels, users may vary the demand intercept  , the demand slope
  , the fixed cost
  , and a cost parameter
  . The average total cost is
  and the marginal cost is
  , which is set equal to marginal benefit for optimal quantity,
  (displayed numerically). Demand is
  and marginal revenue is
  . Price and the cost per unit (based on average total cost) is displayed numerically along the
  axis.
axis.
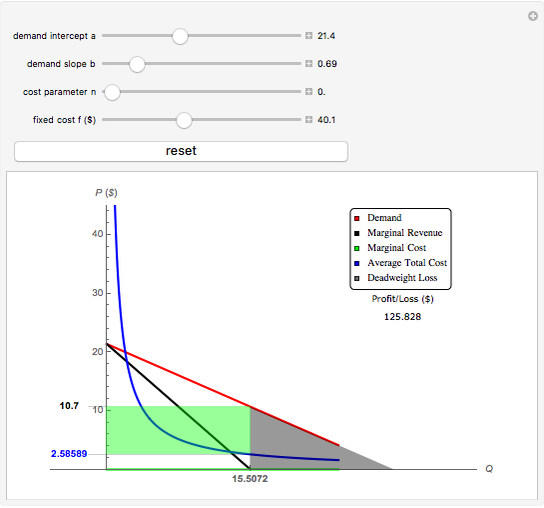
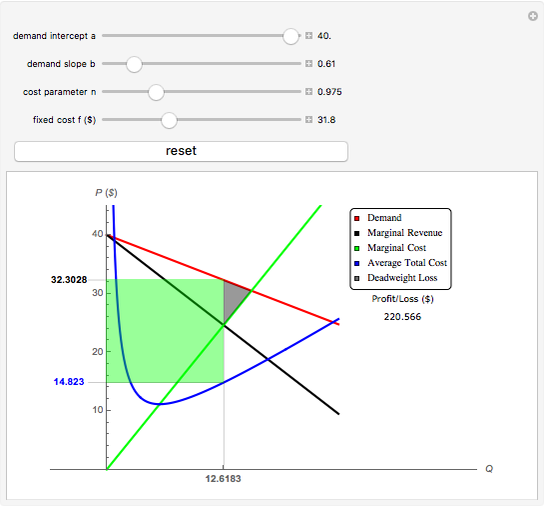
Total profit or loss—price per unit minus cost per unit times quantity sold—appears as a green (profit) or a red (loss) rectangle. It is also displayed numerically on the right to enhance understanding.
You may set demand slope to zero to show the connection between the monopoly and competition models. You may also set the cost parameter to zero to illustrate a zero-marginal-cost monopoly (e.g. a media firm).
Permanent Citation
 Competitive Model
David Youngberg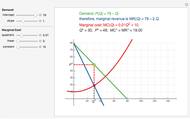 Monopoly Profit-Maximization with Quadratic Marginal Cost
Thomas Mitchell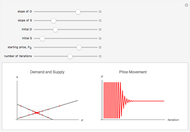 Cobweb Model
Samuel G. Chen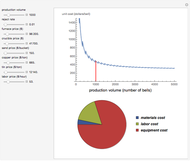 Process-Based Cost Model for Sand-Casting Bronze Bells
Sam Shames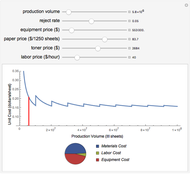 Process-Based Cost Model for a Print and Copy Firm
Sam Shames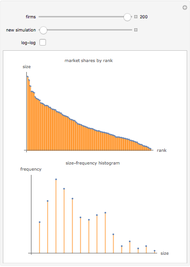 A Model of Market Shares II
Fiona Maclachlan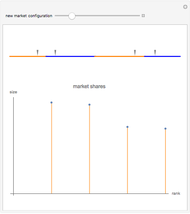 A Model of Market Shares I
Fiona Maclachlan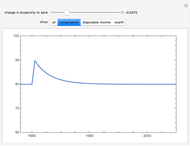 The Paradox of Thrift in a Simple Stock-Flow Consistent Model
Kevin W. Capehart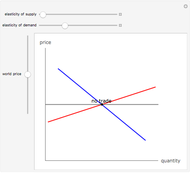 Gains from Trade
Fiona Maclachlan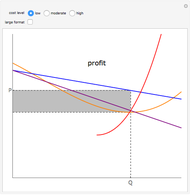 Monopoly Profit and Loss
Fiona Maclachlan