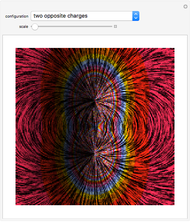
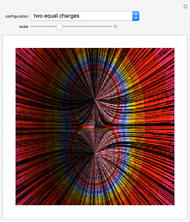
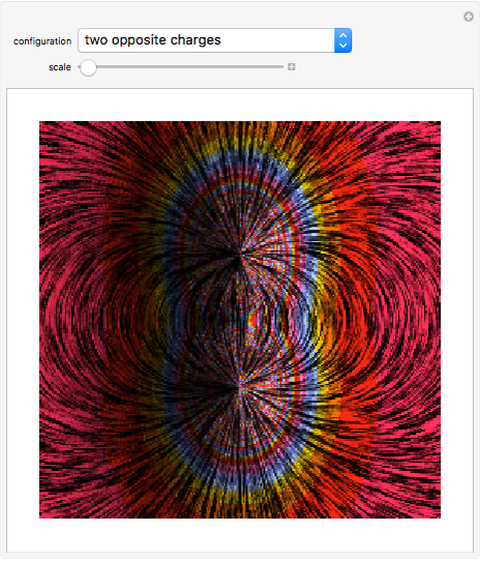
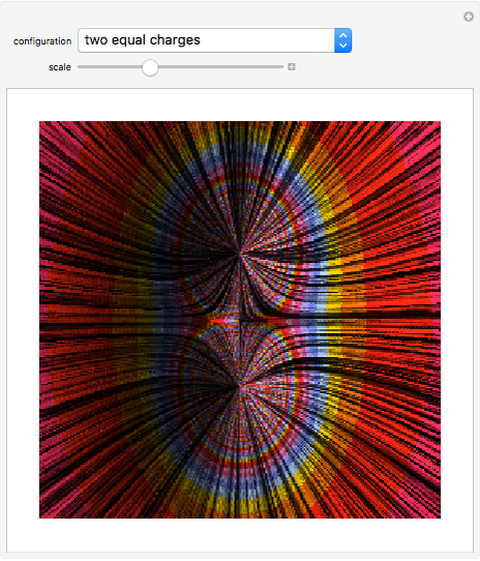
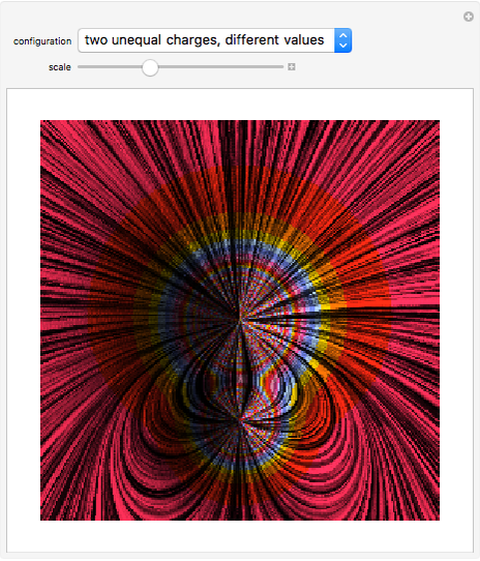
Plotting Electric Fields with Line Integral Convolution


Requires a Wolfram Notebook System
Interact on desktop, mobile and cloud with the free Wolfram Player or other Wolfram Language products.
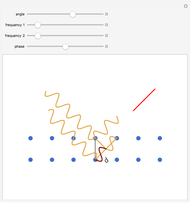
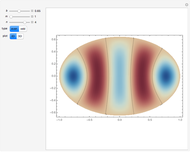
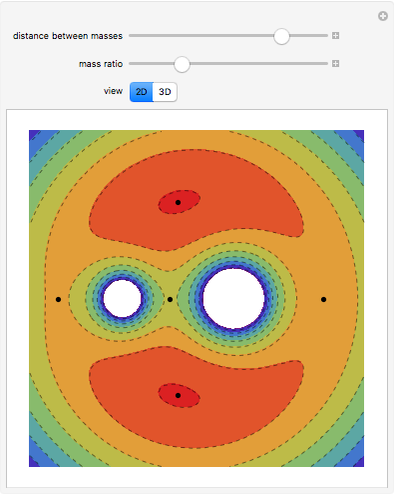
Several configurations of charges are plotted using the line integral convolution algorithm. In each case, it is possible to observe different charateristics of the fields. Bands of the same color stand for equipotential curves. Try to recognize whether they are positive or negative and determine their relative sizes.
Contributed by: Enrique Zeleny (January 2014)
Open content licensed under CC BY-NC-SA
Snapshots

Details
Reference
[1] Wikipedia. "Line Integral Convolution." (Mar 22, 2013) en.wikipedia.org/wiki/Line_integral_convolution.
Permanent Citation
"Plotting Electric Fields with Line Integral Convolution"
http://demonstrations.wolfram.com/PlottingElectricFieldsWithLineIntegralConvolution/
Wolfram Demonstrations Project
Published: January 24 2014
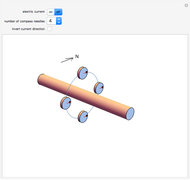 Creation of a Magnetic Field by an Electric Current
Enrique Zeleny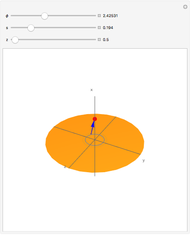 Axial Electric Field of a Charged Disk
Enrique Zeleny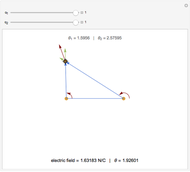 Electric Field Generated by Two Point Charges
Enrique Zeleny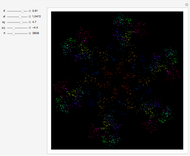 Dynamics of a Charged Particle in a Magnetic Field with a Kicked Electric Field
Enrique Zeleny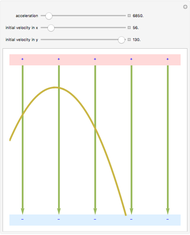 Charged Particle in a Constant Electric Field Produced by Two Plates
Enrique Zeleny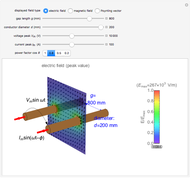 Electric and Magnetic Fields near a Transmission Line
Y. Shibuya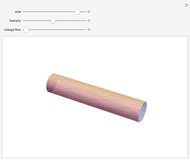 Electric Current
Enrique Zeleny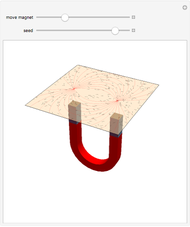 Observing Magnetic Fields with Iron Filings
Enrique Zeleny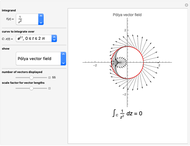 Pólya Vector Fields and Complex Integration along Closed Curves
Don Krug and Steven Wilkinson Compass Needle in Uniform and Rotating Magnetic Fields
Enrique Zeleny
-
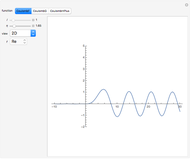
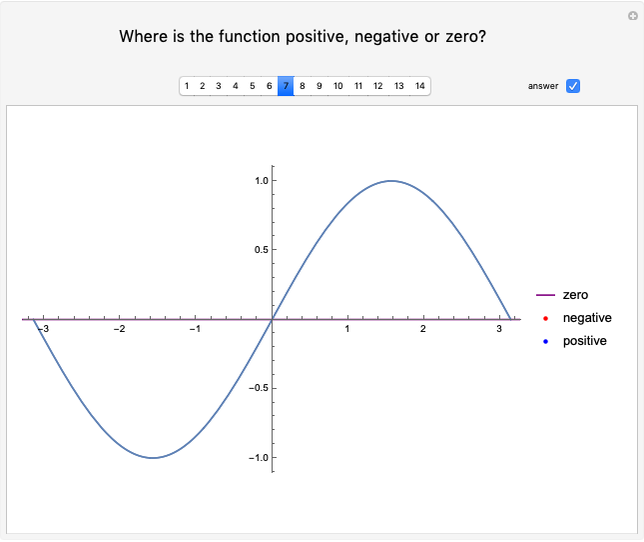 Sign of a Function
Enrique Zeleny -
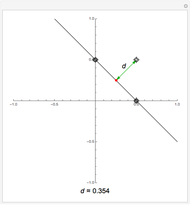 Length of the Perpendicular from a Point to a Straight Line
Enrique Zeleny -
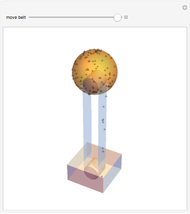 Van de Graaff Generator
Enrique Zeleny -
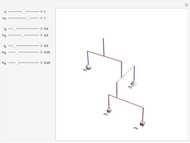 Equilibrium of a Suspended Mobile
Enrique Zeleny -
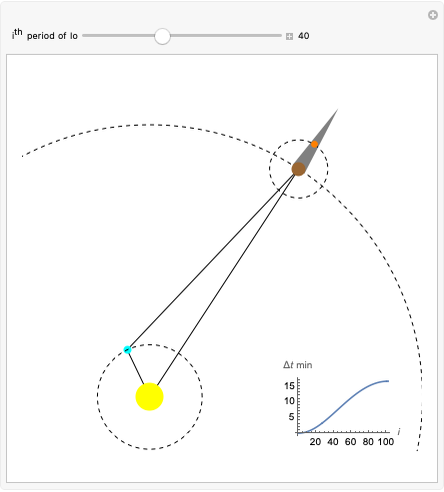 Rømer's Measurement of the Speed of Light
Enrique Zeleny -
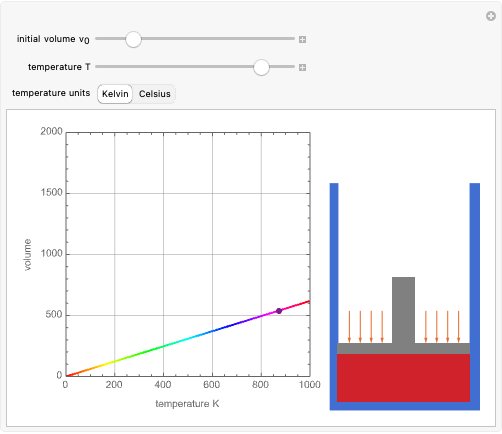 Charles's Law
Enrique Zeleny -
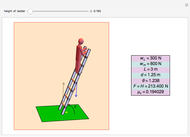 Forces Acting on a Ladder
Enrique Zeleny -
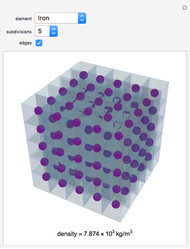 Density
Enrique Zeleny -
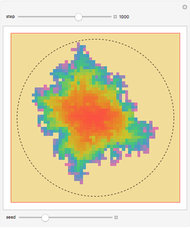 Tumor Growth Model
Enrique Zeleny -
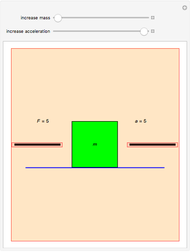 Newton's Second Law
Enrique Zeleny -
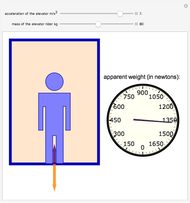 Weight of a Person Riding in an Elevator
Enrique Zeleny -
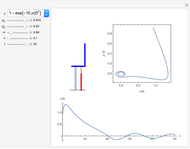 Active Shock Absorbers
Enrique Zeleny -
 Bragg's Law
Enrique Zeleny -
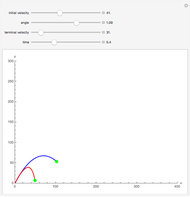 Projectile with Air Drag
Enrique Zeleny -
 Coulomb Wavefunctions
Enrique Zeleny -
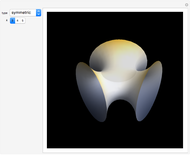 Jorge-Meeks K-Noids
Enrique Zeleny -
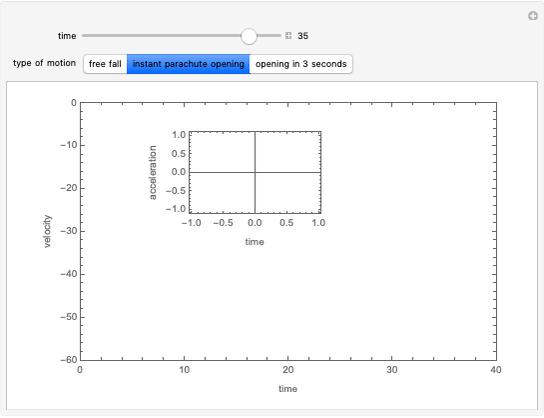 Motion of a Parachuter
Enrique Zeleny -
 Asimov's Ladder of Physical Constants
Enrique Zeleny -
 Solutions of the Elliptic Membrane Problem
Enrique Zeleny -
 Lagrange Points
Enrique Zeleny